Assessing The Fear Index
Market Insights
By Brian Weisenberger, CFA, Senior Market Strategist
Market Insights is a piece in which Kensington’s Portfolio Management team will share interesting and thought-provoking charts that we believe provide insight into markets and the current investment landscape.
Last week, the Chicago Board Options Exchange’s CBOE Volatility Index (“VIX”) dropped to 12.46, marking its lowest reading since January 2020 (see below). Commonly referred to as Wall Street’s “Fear Index,” the VIX often serves as a proxy for risk in the market. The higher it moves, the greater the uncertainty in the equity markets, while equities tend to flourish when it trends lower.

Despite recent widespread predictions of a recession in 2024, market participants now appear less concerned about a potential stock market pullback, at least not in the next 30 days, the period the VIX measures. As we approach month-end, the S&P 500 is poised to record its third-best November return in the last 50 years (see chart below).
S&P 500 Tracks One of Its Best November Gains on Record
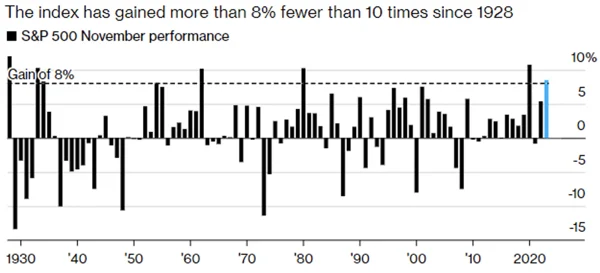
Note: 2023 is as of Nov. 27 close
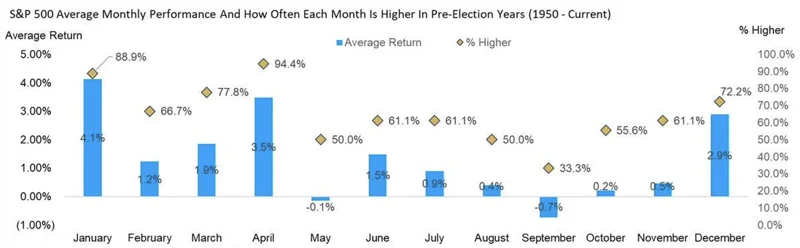
Based on the current reading of the VIX, market participants seemingly anticipate this positive momentum in equities to continue into year-end, a reasonable expectation given historical seasonality. Since 1950, December ranks as the third-highest performing month, boasting an average return of 2.9%, outperforming that level 72.2% of the time in pre-election years (see chart below).
December Tends To Do Quite Well in a Pre-Election Year
@ryandetrick
Historical precedent indicates that when the VIX hits this depressed level, the 12-month forward-looking return is robust, averaging 10.3%, with a positive performance outcome 88% of the time. Though more subdued, the 6-month forward return has also historically been strong, averaging 4.5%, with positive performance 77% of the time (see chart below).
S&P 500 Forward 6-Month Performance vs VIX Level

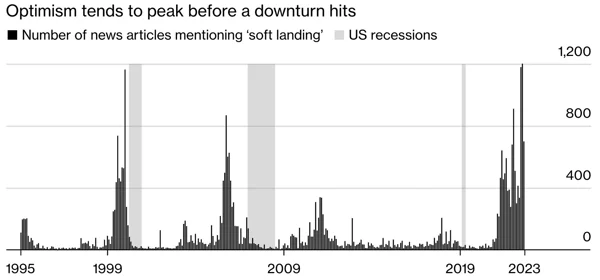
Despite these reasons for optimism, there are some warning signs that warrant caution. A contributing factor to the low “fear index” is likely the increased references to a “soft landing” for the economy in news articles. However, as illustrated in the chart below, optimism for a soft landing tends to peak before a downturn, as seen before both the Dot Com Crash in 2000/2001 and the Great Financial Crisis in 2008/2009.
Soft Landing Hopes and hard Landing Realities
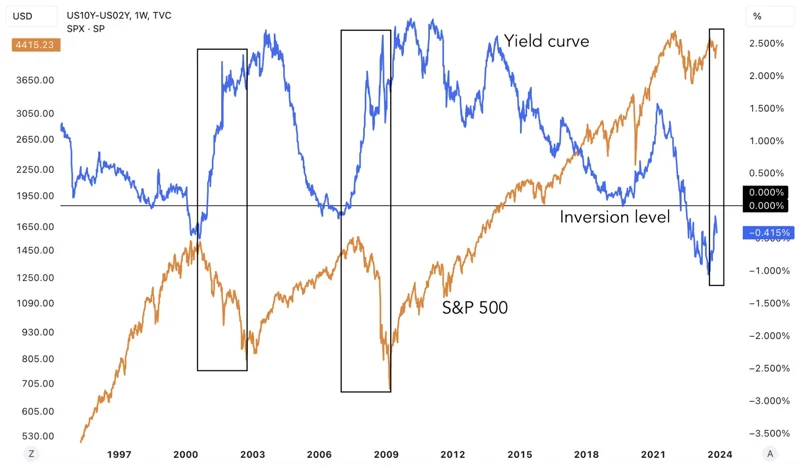
Furthermore, reduced market “fear” is being somewhat driven by the expectation that the Federal Reserve will not only pause rate hikes, but in fact cut rates through 2024. This expectation has fueled the steepening of the 10Y-2Y yield curve, which historically coincides with significant market drops (see chart below).
In navigating the current market landscape, investors find themselves at a crossroads of conflicting signals and on-going risks. The recent plunge in the CBOE Volatility Index may suggest a prevailing sense of calm, but history cautions us to remain vigilant. The juxtaposition of historical data and emerging indicators underscores the need for an investing approach that acknowledges both the prevailing optimism and the underlying risks. In this environment, a prudent and agile strategy will be key as we navigate the complexities of the market in the weeks and months ahead.
Disclaimers:
Forward-looking statements are based on management’s then current views and assumptions and, as a result, are subject to certain risks and uncertainties that could cause actual results to differ materially from those projected. This market insight is for informational purposes only and should not be construed as a solicitation to buy or sell, or to invest in any investment product or strategy. Investing involves risk including loss of principal.
Related Perspectives
View All-
KENSINGTON SPOTLIGHT SERIES: THE DEFENDER STRATEGY
At Kensington Asset Management, we’ve actively managed fixed income solutions for clients for over three decades. Throughout this journey, we’ve weathered all types of macroeconomic regimes from extreme market volatility events to periods of steady growth.
-
White paper: Trend Following and Tail Risk
An introductory understanding of how trend following can manage tail risk.