Strategy Review – February 2026
(Market Data as of 02/28/2026)
Monthly Strategy Commentary
By Kensington Asset Management Team
RISK ASSETS WERE MIXED IN FEBRUARY AS BONDS RALLIED AND REAL ASSETS STAYED FIRM
February’s market backdrop was characterized by a rotation away from concentrated US growth leadership and toward areas that typically benefit from falling yields and improving market participation. US large caps finished modestly lower, with the S&P 500 down -0.87% and the Nasdaq 100 down -2.32%, while small caps were positive (Russell 2000 +0.71%), reinforcing the theme of a broader, more balanced market than investors experienced for much of the past year.
Outside the US, developed international equities advanced +5.45% (MSCI EAFE Index) and MSCI Emerging Markets Index rose +4.95%, supported by improving relative momentum and a US dollar that was modestly weaker on the month (Bloomberg Dollar Spot -0.07%).
In fixed income, duration-sensitive areas led as yields declined. The Bloomberg US Aggregate Bond Index returned +1.64%, with Treasuries +1.82% and US investment grade corporates +1.29%. Credit remained constructive but relatively subdued versus rates, with US corporate high yield up +0.19%.
Real assets again contributed meaningfully to diversified portfolios. Gold (S&P GSCI Gold Index TR) was particularly strong (+10.91%), while broad commodities gained +2.13% (S&P GSCI Index).
MANAGED INCOME STRATEGY
Author: Kensington Asset Management PM Team
| Feb 2026 | YTD | 1 Year | 3 Years | 5 Years | 10 Years | 15 Years | Since Inception | |
|---|---|---|---|---|---|---|---|---|
| Kensington Managed Income Strategy (*Gross) | 0.52% | 1.15% | 5.93% | 6.32% | 3.04% | 5.27% | 5.54% | 8.28% |
| Kensington Managed Income Strategy (**Net 3%) | 0.29% | 0.66% | 2.80% | 3.17% | -0.01% | 2.16% | 2.42% | 5.08% |
| Bloomberg US Agg Bond TR USD | 1.64% | 1.75% | 6.26% | 5.12% | 0.42% | 1.97% | 2.51% | 3.06% |
Inception Date: 12/31/2007 (Returns exceeding one year are annualized.)
Managed Income Strategy returned 0.52% gross (0.29% net) for the month of February. After lagging in recent months, duration-sensitive bonds led the way in February as high yield took a pause, supported by a meaningful decline in Treasury yields during the month.
During February, the Managed Income Strategy remained in a fully risk-on stance, maintaining a portfolio comprised mainly of US high yield corporates, with satellite positioning in multisector bonds. Multisector exposures performed positively during the month and provided diversification as rate-sensitive areas outperformed.
We continue to monitor the near-term credit backdrop particularly given the recent pickup in headline risk and shifting risk appetite.
CREDIT OPPORTUNITIES STRATEGY
Author: Kensington Asset Management PM Team
| Feb 2026 | YTD | 1 Year | 3 Years | Since Inception | |
|---|---|---|---|---|---|
| Kensington Credit Opportunities Strategy (*Gross) | 0.12% | 0.70% | 2.14% | 5.78% | 5.98% |
| Kensington Credit Opportunities Strategy (**Net 3%) | -0.11% | 0.21% | -0.88% | 2.65% | 2.85% |
| Bloomberg US Agg Bond TR USD | 1.64% | 1.75% | 6.26% | 5.12% | 5.18% |
Inception Date: 8/31/2022 (Returns exceeding one year are annualized.)
Credit Opportunities Strategy returned 0.12% gross (-0.11% net) for the month of February. The Strategy remained fully invested during the month and continued to be high-yield-centric, complemented by satellite allocations to investment grade corporates, asset-backed securities, and Treasuries. These satellite positions outperformed high yield during February as market participants favored higher-quality credit and duration exposure.
The Strategy continues to evaluate yield opportunities while maintaining flexibility to adjust exposures as relative value and market conditions change.
DYNAMIC ALLOCATION STRATEGY
Author: Kensington Asset Management PM Team
| Feb 2026 | YTD | 1 Year | 3 Years | 5 Years | 10 Years | Since Inception | |
|---|---|---|---|---|---|---|---|
| Kensington Dynamic Allocation Strategy (*Gross) | -1.06% | -1.10% | 34.55% | 16.77% | 12.70% | 17.58% | 16.56% |
| Kensington Dynamic Allocation Strategy (**Net 3%) | -1.29% | -1.58% | 30.58% | 13.32% | 9.37% | 14.11% | 13.11% |
| S&P 500 TR USD | -0.87% | 0.49% | 16.99% | 21.80% | 14.19% | 15.50% | 13.38% |
Inception Date: 12/31/2014 (Returns exceeding one year are annualized.)
Dynamic Allocation Strategy returned -1.06% gross (-1.29% net) for the month of February. Equity markets were mixed, with large-cap benchmarks lower while small caps held up better, extending the theme of improving market participation and a rotation away from the narrow leadership that has defined much of the past year.
The Strategy began February in a Risk-On positioning but shifted to Risk-Off early in the month as relative weakness in technology-heavy equities persisted. The Strategy remained risk-off at month-end, holding cash equivalents and short-duration bond exposures.
In the near term, trend conditions have softened in the Nasdaq Composite, while select diversifying segments such as defensive, value, and small caps have shown improved momentum. If the Strategy re-enters a Risk-On posture, areas allocations would be adjusted toward areas showing stronger relative trends at that time rather than relying on a narrow set of mega-cap growth exposures.
ACTIVE ADVANTAGE STRATEGY
Author: Kensington Asset Management PM Team
| Feb 2026 | YTD | 1 Year | 3 Years | Since Inception | |
|---|---|---|---|---|---|
| Kensington Active Advantage Strategy (*Gross) | 0.74% | 2.32% | 14.91% | 11.46% | 6.04% |
| Kensington Active Advantage Strategy (**Net 3%) | 0.51% | 1.83% | 11.52% | 8.16% | 2.91% |
| 50/50 S&P 500 TR / Bloomberg US Agg | 0.43% | 1.21% | 11.73% | 13.37% | 5.66% |
Inception Date: 12/31/2021 (Returns exceeding one year are annualized.)
Active Advantage Strategy returned 0.74% gross (0.51% net) for the month of February. The Strategy remained fully invested and continued to target an approximate 50% allocation to fixed income and 50% to equities.
Performance reflected exposure to investment grade fixed income, high dividend and value-oriented equities, and international exposures during the month, which contrasted with ongoing softness in growth-oriented equity segments for a second consecutive month.
The portfolio is currently positioned in a balanced Risk-On posture, with ongoing monitoring for potential tactical adjustments should market conditions change.
DEFENDER STRATEGY
Author: Elio Chiarelli, PhD, AIF – Lead Portfolio Manager, Liquid Strategies
| Feb 2026 | YTD | 1 Year | Since Inception | |
|---|---|---|---|---|
| Kensington Defender Strategy (*Gross) | 4.81% | 10.26% | 23.39% | 12.40% |
| Kensington Defender Strategy (**Net 3%) | 4.57% | 9.73% | 19.75% | 9.09% |
| Morningstar Global 60/40 NR USD | — | — | — | — |
Inception Date: 12/31/2021 (Returns exceeding one year are annualized.)
During February, markets continued to navigate a complex macro environment as resilient activity showed early signs of moderation. Investors remained focused on inflation trends and the timing of potential Fed policy easing, which continued to influence both equity leadership and fixed income returns.
Against this backdrop, the Defender Strategy generated strong relative results during the month, supported by tactical allocation decisions early in February. The portfolio exited Nasdaq-100 exposure and reallocated toward commodities and real asset exposures as momentum and macro positioning shifted, which aligned with a market environment where inflation-sensitive assets outperformed while growth-oriented equities experienced greater volatility.
We continue to monitor evolving market conditions with a disciplined approach. The Strategy is designed to help emphasize resilience across a wide range of market environments through diversified exposures and tactical adjustments as market regimes evolve.
HEDGED PREMIUM INCOME STRATEGY
Author: Shawn Gibson – CIO, Lead Portfolio Manager, Liquid Strategies
| Feb 2026 | YTD | 1 Year | Since Inception | |
|---|---|---|---|---|
| Hedged Premium Income Strategy (*Gross) | 0.48% | 1.32% | 11.45% | 12.47% |
| Hedged Premium Income Strategy (**Net 3%) | 0.25% | 0.83% | 8.15% | 9.16% |
| S&P 500 TR USD | -0.87% | 0.49% | 16.99% | 14.76% |
Inception Date: 10/31/2023 (Returns exceeding one year are annualized.)
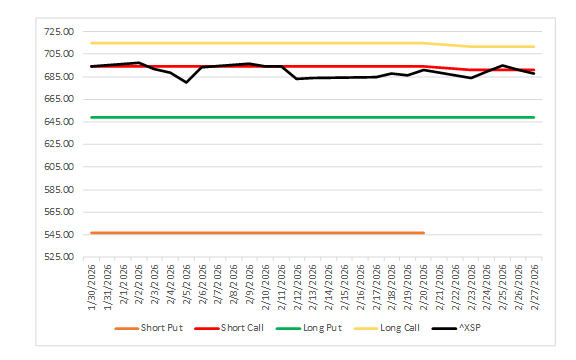
During February, the S&P 500 traded in a relatively tight range despite elevated stock-level dispersion beneath the surface. The Strategy’s option premium framework is designed to provide return potential in flatter equity environments, and this profile was evident in February as the Strategy delivered a positive gross return of 0.48% (0.25% net), while the S&P 500 declined for the month -0.87%.
Option premiums increased during the month, allowing the Strategy to generate approximately 1.52% in premium from the income-producing call spread. The call spread finished modestly above the Index at the expiration parameters, and the downside hedge finished below the Index. As an update, the short side of the downside buffer was closed on February 20 after it no longer offered sufficient value to offset the risk, resulting in the Strategy finishing the month with a defined floor rather than a buffer. Both option positions are scheduled to expire on March 20.
Source: LiveVol, Liquid Strategies, LLC
Disclaimers:
Investing involves risk, including loss of principal. Past performance does not guarantee future results. There is no guarantee any investment strategy and/or diversification will generate a profit or prevent a loss. Targeted distributions are not guaranteed.
This is for informational purposes only and is not a recommendation nor solicitation to buy, sell or invest in any investment product or strategy. Our materials may contain information deemed to be correct and appropriate at a given time but may not reflect our current views or opinions due to changing market conditions. No information provided should be viewed as or used as a substitute for individualized investment advice. An investor should consider the investment objectives, risks, charges, and expenses of the investment and the strategy carefully before investing.
Any indices and other financial benchmarks shown are provided for illustrative purposes only, are unmanaged, reflect reinvestment of income and dividends and do not reflect the impact of advisory fees. Investors cannot invest directly in an index. Comparisons to indexes have limitations because indexes have volatility and other material characteristics that may differ from a particular strategy such as the types of securities being substantially different.
KAM relies on third party sources for some of its information that we believe is reliable. However, we make no representation, warranty, endorse or affirm as to its accuracy or completeness. The information provided is current as of the date of publication and may be subject to change. We are not responsible for updating this information to reflect any subsequent developments or events.
Certain information contained herein constitutes “forward-looking statements,” which can be identified using forward-looking terminology such as “may,” “will,” “should,” “expect,” “anticipate,” “project,” “estimate,” “intend,” “continue,” or “believe,” or the negatives thereof or other variations thereon or comparable terminology. Due to various risks and uncertainties, actual events, results, or actual performance may differ materially from those reflected or contemplated in such forward looking statements. Nothing contained herein may be relied upon as a guarantee, promise, assurance, or a representation as to the future.
Advisory services offered through Kensington Asset Management, LLC, Barton Oaks Plaza, Bldg II, 901 S Mopac Expy – Ste 225, Austin, TX 78746. Liquid Strategies, LLC, serves as a Sub Advisor for the Kensington Defender Strategy and investment adviser to Hedged Premium Income Strategy. Liquid Strategies, LLC is not affiliated with KAM.
Important Disclosures | Glossary
For performance and important risks about the investment strategies, visit:
Managed Income Strategy | Credit Opportunities Strategy | Dynamic Allocation Strategy | Active Advantage Strategy | Defender Strategy
Hedged Premium Income Strategy
The Strategy invests in options that derive their performance from the performance of the S&P 500 Index. Selling (writing) and buying options are speculative activities and entail greater than ordinary investment risks. The Strategy’s use of put options can lead to losses because of adverse movements in the price or value of the underlying asset, which may be magnified by certain features of the options. When selling a put option, the Strategy will receive a premium; however, this premium may not be enough to offset a loss incurred by the Strategy if the price of the underlying asset is below the strike price by an amount equal to or greater than the premium. Purchased put options may expire worthless and the Strategy would lose the premium it paid for the option. The Strategy may lose significantly more than the premiums it receives in highly volatile market conditions.
The Strategy will invest in short term put options which are financial derivatives that give buyers the right, but not the obligation, to sell (put) an underlying asset at an agreed-upon price and date. The Strategy’s use of options may reduce the Strategy’s ability to profit from increases in the value of the underlying asset. The Strategy could experience a loss or increased volatility if its derivatives do not perform as anticipated or are not correlated with the performance of their underlying asset
KAM20260312
Related Perspectives
View All-
Monthly Market Commentary – February 2026
Risk assets delivered mixed but generally positive results in November as investors weighed softer labor data, the ongoing government shutdown, and the prospect of another Federal Reserve rate cut in December.
-
Strategy Review – January 2026
Risk assets delivered mixed but generally positive results in November as investors weighed softer labor data, the ongoing government shutdown, and the prospect of another Federal Reserve rate cut in December.
