The Growing Role of Technology
Market Insights
By Kensington Asset Management Team
Market Insights is a weekly piece in which Kensington’s Portfolio Management team will share interesting and thought-provoking charts that we believe provide insight into markets and the current investment landscape.
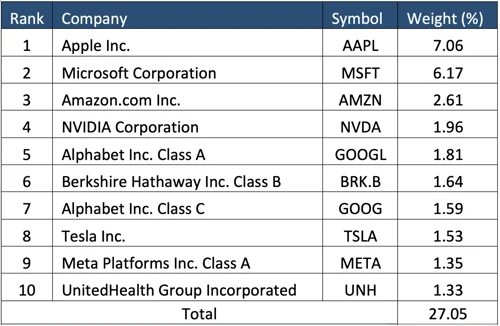
Investors often confuse the S&P 500 Index (SPX) as a proxy for the “market” and a measure of market health, but this can be misleading when there is significant performance dispersion amongst the different underlying sector components. This is particularly relevant today as the top holdings within the index continue to account for a significantly higher percentage of the index allocation. Today the top 10 holdings (2% of the constituents) in SPX account for over 27% of the overall attribution of the index, with a strong concentration towards technology. As these companies go, so goes the index, and this can lead to a distorted view of the “market”.
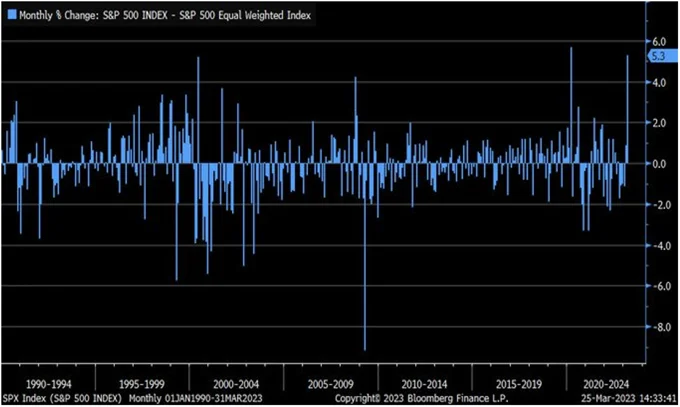
For the month of March (through March 24th), the traditional cap-weighted SPX has outperformed the equal weighted S&P 500 Index by 5.3%, which is something that has only occurred twice in the past several decades (March 2020, June 2000).
This is where cap weighting and industry concentration come into play. If you look at sector performance (below), only 3 of 11 sectors are positive year-to-date, with Communications, Technology and Consumer Discretionary holding at least a 10% lead over all other sectors, and the widest dispersion (Communications vs Energy) coming in at a whopping 28.4%.

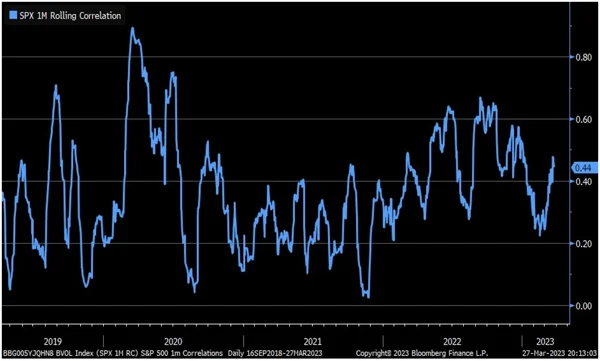
In the two-week period ending March 24th, 60% of SPX constituents registered negative returns, despite the Index gaining over 2% during the period. This can be measured through correlation of the SPX constituents as well (below). While correlations amongst the underlying companies have been on the rise, they have been abnormally low through much of the first quarter, particularly for a period of market stress.
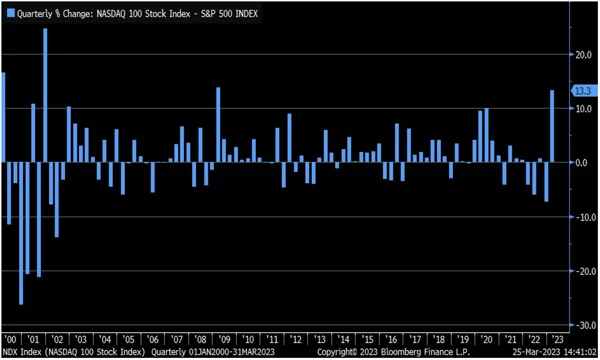
The difference is even more glaring when comparing the very technology heavy NASDAQ 100 against the S&P 500. Through March 25th the NASDAQ is having its best quarter relative to SPX since the first quarter of 2009.
The relevance of this dispersion is yet to be known but acts as a good reminder of the pitfalls of evaluating the market and its relative strength of weakness by one index alone (particularly a cap weighted one). While technology plays a significant and growing role in the overall market and economy, it can’t carry the load forever.
Disclaimers:
Forward-looking statements are based on management’s then current views and assumptions and, as a result, are subject to certain risks and uncertainties that could cause actual results to differ materially from those projected. This market insight is for informational purposes only and should not be construed as a solicitation to buy or sell, or to invest in any investment product or strategy. Investing involves risk including loss of principal.
Related Perspectives
View All-
KHPI’s Fiscal Year 2025 Review and the Power of Net-of-Tax Performance
KHPI’s Fiscal Year 2025 Review and the Power of Net-of-Tax Performance Monthly Market Commentary By Kensington Asset Management Team The following is for informational purposes only and not construed as tax advice. Please consult with a tax professional for your specific situation. For the modern fiduciary, performance is a multi-dimensional metric. While investment returns capture […]
-
KENSINGTON SPOTLIGHT SERIES: THE DEFENDER STRATEGY
At Kensington Asset Management, we’ve actively managed fixed income solutions for clients for over three decades. Throughout this journey, we’ve weathered all types of macroeconomic regimes from extreme market volatility events to periods of steady growth.
