The Importance Of Objective Reasoning
Market Insights
By Kensington Asset Management Team
Market Insights is a weekly piece in which Kensington’s Portfolio Management team will share interesting and thought-provoking charts that we believe provide insight into markets and the current investment landscape.
Making a Case for the Bulls
Over the past several weeks we have discussed the potential credit crunch facing the U.S., the risk of negative Q1 earnings surprises, and the impact of elevated market volatility, making the case for a predominantly bearish veiwpoint on the overall market. These risks still persist, and most investors seem to agree. As seen in the chart below, investors currently hold their shortest net position on equities since late 2011.
Despite these headwinds, US equity markets continue to advance, approaching year-to-date highs this week fueled by better-than-expected (so far) 1st quarter earnings and a cooler-than-expected inflation report. So, rather than continuing to highlight the risks that exist in today’s market, let’s take a short reprieve and highlight the case for a more bullish stance going forward.
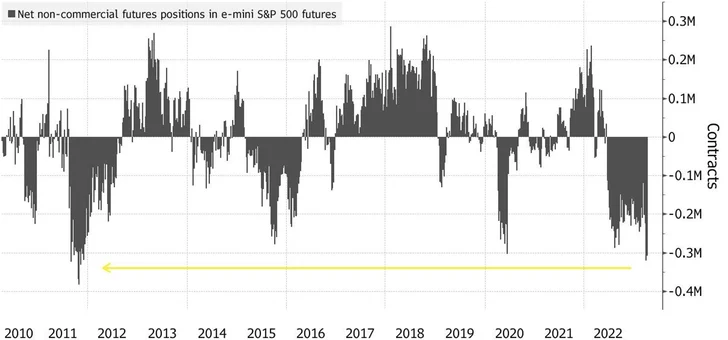
Source: CFTC, Bloomberg
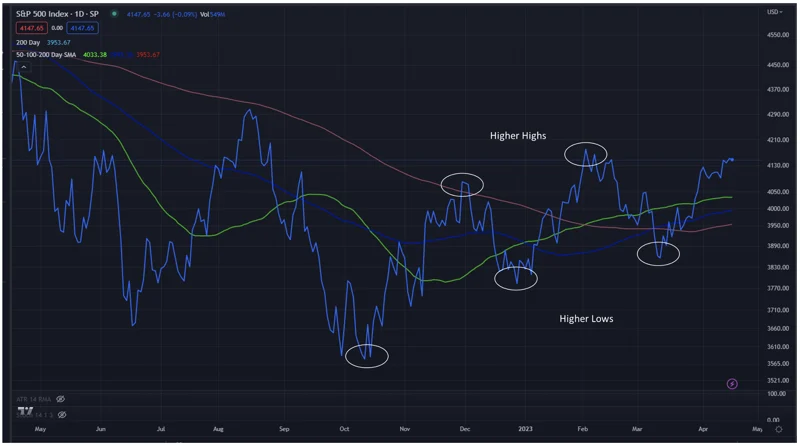
One positive indicator for the short term development of the S&P 500 is the index showing “higher highs and higher lows” dating back to mid-October. When peaks and troughs are ascending on a chart, as they are in the chart below, it is often viewed as a bullish signal, as the market stair-steps upward and creates a higher support level with each step. If the current upward trend, which began in mid-March, pushes to another “higher high,” it could be viewed as supporting bullish expectations.
History On Our Side
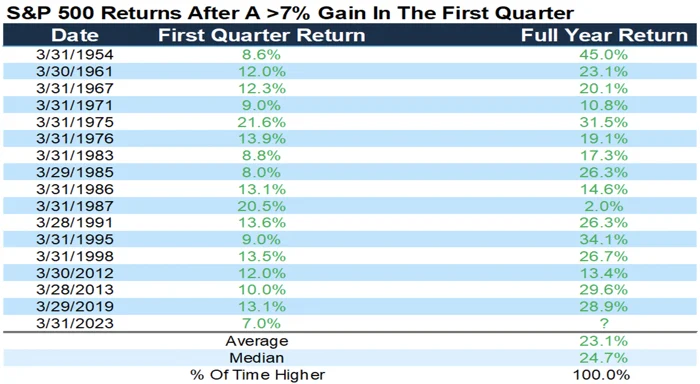
There is cause for optimism from a historical perspective as well. As seen from the chart below, when the S&P 500 returns 7% or more (as it did this year) in the 1st quarter, the index has never finished lower for the remainder of the year. The average full-year return dating back to 1954 is 23.1%.
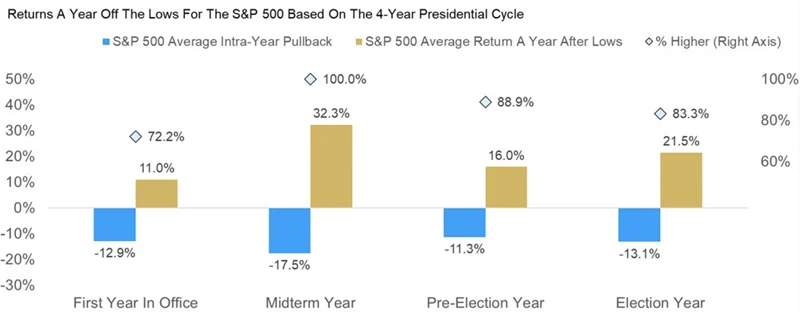
We also have the presidential election cycle on our side. Midterm election years (like this year) historically have seen a big bounce off previous lows, with an average return of 32.3% the year after the low was hit.
Where Do We Go From Here?
So, where does that leave us? Despite a pervasive bearish outlook on the part of most investors, the market continues to march ahead. However, historical patterns suggest it may just continue. Sometimes, the market doesn’t care about the fundamentals. As famed economist John Maynard Keynes once said, “Markets can remain irrational longer than you can remain solvent.” The current disconnect between market sentiment (negative) and market performance (positive) underscores the importance of applying objective reasoning to shape one’s investment perspective as opposed to relying on the emotional appeal of subjective guesswork.
Disclaimers:
Forward-looking statements are based on management’s then current views and assumptions and, as a result, are subject to certain risks and uncertainties that could cause actual results to differ materially from those projected. This market insight is for informational purposes only and should not be construed as a solicitation to buy or sell, or to invest in any investment product or strategy. Investing involves risk including loss of principal.
Related Perspectives
View All-
KENSINGTON SPOTLIGHT SERIES: THE DEFENDER STRATEGY
At Kensington Asset Management, we’ve actively managed fixed income solutions for clients for over three decades. Throughout this journey, we’ve weathered all types of macroeconomic regimes from extreme market volatility events to periods of steady growth.
-
White paper: Trend Following and Tail Risk
An introductory understanding of how trend following can manage tail risk.