US Earnings Season
Market Insights
By Kensington Asset Management Team
Market Insights is a weekly piece in which Kensington’s Portfolio Management team will share interesting and thought-provoking charts that we believe provide insight into markets and the current investment landscape.
Earnings Season Upon Us
As we close out the first quarter in which equity indices moved markedly higher despite growing economic concerns, we now shift focus to Q1 earnings in the coming weeks for a snapshot of corporate health for Q1. Looking back, the fourth quarter of 2022 saw a blended earnings decline for the S&P 500 of -4.6%, the first time the index has reported a year-over-year decline in earnings since Q3 2020 (-5.7%).
Expectations for Q1 2023 are even worse. Analysts estimate a decline in earnings for the S&P 500 of -6.6% year-over-year. If -6.6% is the actual decline for the quarter, it will mark the largest earnings decline reported by the index since Q2 2020 (-31.8%).
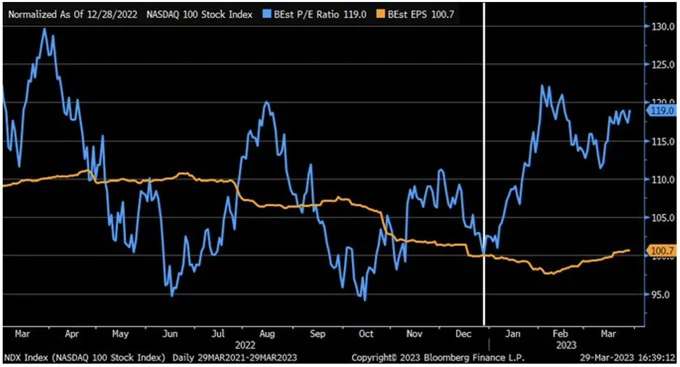
Despite tempered earnings expectations for Q1, equity indices rallied the first three months of the year, particularly the tech heavy NASDAQ 100 Index, which is up over 20% year-to-date. However, as demonstrated in the chart below, nearly all of the gain was driven by forward P/E expansion (blue), with forward EPS (orange) only up marginally, leaving the index particularly vulnerable to potential negative earnings surprises.
Earnings Growth Set to Fall?
Analysts use several metrics to try and gauge future earnings growth. One of the most historically reliable forecasting tools for earnings growth has been the ISM Manufacturing Index (PMI), which was released earlier this week, with a reading of 46.3 in March (below), its lowest level in nearly three years, with all five subcomponents of the survey below 50 for the first time since 2009.

PMI tends to lead corporate earnings growth by approximately a year. The below chart from Perfiliev Financial shifts the PMI index forward by 12 months and plots it against the S&P 500 (SPX) trailing 12-months EPS growth. As Perfiliev points out, based on this relationship, this week’s PMI reading of 46.3 implies an earnings contraction of about 8% over the next 12 months, or an SPX EPS of 204. Using the current forward PE ratio of 18.7, this leads to an index level of about 3,815. A “recessionary” PE ratio of 15 will see the index at ~3,060 (a ~25% drop from current levels), assuming no further earnings erosion.
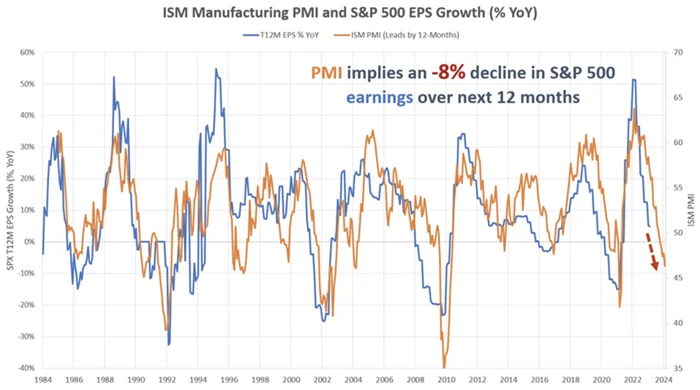
Keep in mind the correlation between the two measures is not perfect, and when accounting for the one-year historical lag, this analysis doesn’t necessarily mean we’re in for a negative earnings surprise for Q1. As mentioned, consensus estimates already forecast an earnings decline of -6.6% for Q1. However, if we do see downside surprises this earnings season it could put pressure on P/E ratios that saw significant expansion in Q1. Despite the seemingly strong start to the year, we are still in delicate territory that requires a disciplined investment approach.
Disclaimers:
Forward-looking statements are based on management’s then current views and assumptions and, as a result, are subject to certain risks and uncertainties that could cause actual results to differ materially from those projected. This market insight is for informational purposes only and should not be construed as a solicitation to buy or sell, or to invest in any investment product or strategy. Investing involves risk including loss of principal.
Related Perspectives
View All-
KHPI’s Fiscal Year 2025 Review and the Power of Net-of-Tax Performance
KHPI’s Fiscal Year 2025 Review and the Power of Net-of-Tax Performance Monthly Market Commentary By Kensington Asset Management Team The following is for informational purposes only and not construed as tax advice. Please consult with a tax professional for your specific situation. For the modern fiduciary, performance is a multi-dimensional metric. While investment returns capture […]
-
KENSINGTON SPOTLIGHT SERIES: THE DEFENDER STRATEGY
At Kensington Asset Management, we’ve actively managed fixed income solutions for clients for over three decades. Throughout this journey, we’ve weathered all types of macroeconomic regimes from extreme market volatility events to periods of steady growth.
