2024 Investment Strategy Review
Monthly Market Commentary
By Kensington Asset Management Team
Introduction
The 2024 Strategies Year in Review encapsulates Kensington Asset Management’s unwavering dedication to navigating complex financial landscapes with precision and foresight. This year presented a mix of opportunity and challenge, defined by persistent economic shifts, historic market volatility, and the Federal Reserve’s nuanced approach to monetary policy. Against this backdrop, each of our strategies demonstrated the resilience and adaptability that are hallmarks of Kensington’s investment philosophy.
From capitalizing on the fixed income rally of midyear to tactically navigating sharp equity market rotations, this report provides an in-depth review of how our strategies performed, how we adapted to evolving market conditions, and the foundational principles that guided our decisions. The insights shared by each portfolio management team highlight the importance of disciplined risk management, tactical allocation, and data-driven decision-making in navigating diverse market environments and delivering outcomes aligned with our investors’ long-term objectives.
As we look ahead to 2025, the lessons learned this year reinforce our commitment to proactive management and innovation. While the road forward may present new complexities, we remain steadfast in our mission to deliver value, resilience, and clarity to our investors.
Brian Weisenberger
Managing Director, Chief Market Strategist
Kensington Asset Management

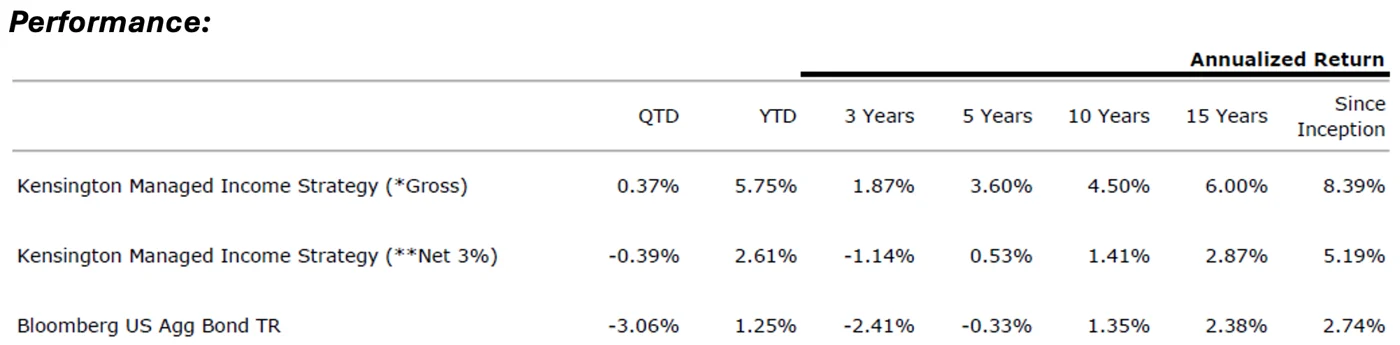
Commentary: The Managed Income Strategy navigated a dynamic fixed income landscape in 2024, characterized by shifting Federal Reserve policies, a reshaping of the yield curve, and evolving market conditions. Predominantly “Risk-On” for the year, the Strategy capitalized on allocations to US High Yield and senior loan/floating rate positions to produce meaningful yield while mitigating interest rate risk. Managed Income got off to a strong start in the first quarter, before paring some gains in April amid heightened volatility. The Strategy briefly shifted defensively before reverting to “Risk-On” by May as US High Yield regained momentum.
Falling yields in the summer sparked a fixed-income rally, leading to Managed Income’s best monthly performance in July. Challenges such as unemployment spikes in August and rate concerns in October created volatility in the markets, which provided opportunities for Managed Income to opportunistically rebalance its portfolio across high yield and senior loans.
By year-end, the Strategy maintained a high-yield-focused allocation complemented by senior loan and floating-rate positions to maximize yield while managing interest rate risk. Despite tight spreads signaling a high yield market that is relatively “expensive” compared to historical averages, the Strategy’s balanced approach effectively navigated a volatile environment, particularly as rates surged in the fourth quarter. We believe this approach paid off, producing Managed Income’s best performing year since 2020.
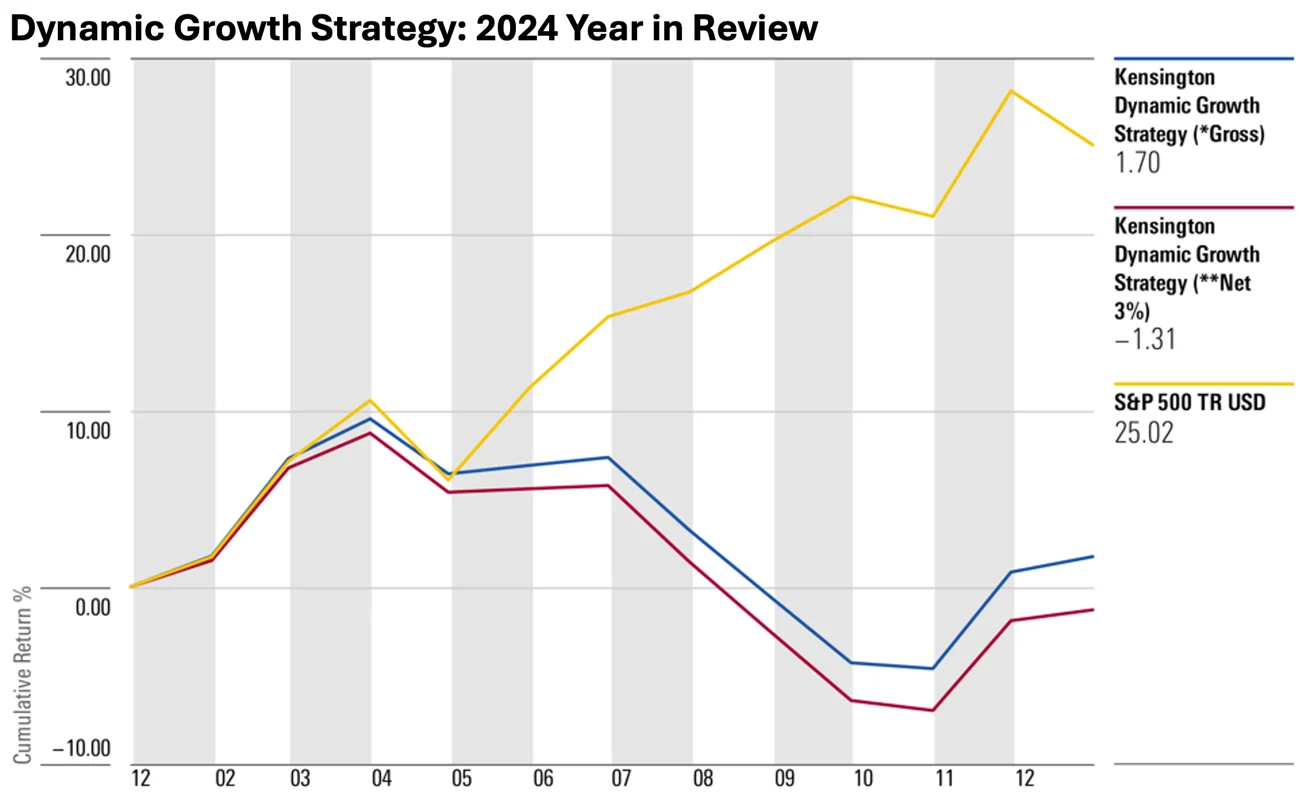
Commentary: The Dynamic Growth Strategy got off to a strong start in 2024, as equities continued to rally on optimism for rate cuts to begin as inflation cooled and the US economy remained strong. Early in the year, a strong “Risk-On” position capitalized on equity rallies led by the “Magnificent Seven” mega-cap tech stocks. However, rising volatility in late April prompted a defensive pivot to cash equivalents, signaling the end of a six-month risk-on streak. This cautious stance continued into May and June, missing robust gains driven by an artificial intelligence-led technology rally. Despite the overall strength of the equity markets, narrow market breadth highlighted the dominance of a few mega-cap stocks, prompting Dynamic Growth to remain on the sidelines.
In the third quarter, the Strategy oscillated between “Risk-On” and “Risk-Off” positions as markets experienced sharp swings. July saw a return to growth equities, but mid-month pullbacks and a rotation into small-cap stocks led to underperformance. August and September presented heightened volatility, resulting in defensive moves that avoided significant losses but also missed rebounds, resulting in “whipsaw” trades. By November, the Strategy capitalized on a strong equity resurgence, posting its best monthly performance since 2022. However, underperformance during the third quarter resulted in Dynamic Growth underperforming the broad equity indices by a wide margin.
Unfortunately, the challenges experienced in the third quarter erased most of Dynamic Growth’s 2024 return potential. However, it is important to note this same defensive discipline can potentially guard against drawdowns. While Dynamic Growth underachieved in 2024, a year marked by explosive growth across a very concentrated group of equity names, we believe our approach is integral to long-term success. Historically, these periods of “out of sync” performance are often followed by a reversion to the mean, which occurred in November and December as the Strategy outpaced its benchmark. Moving into 2025, Dynamic Growth maintains its commitment to managing downside risk while pursuing growth opportunities.
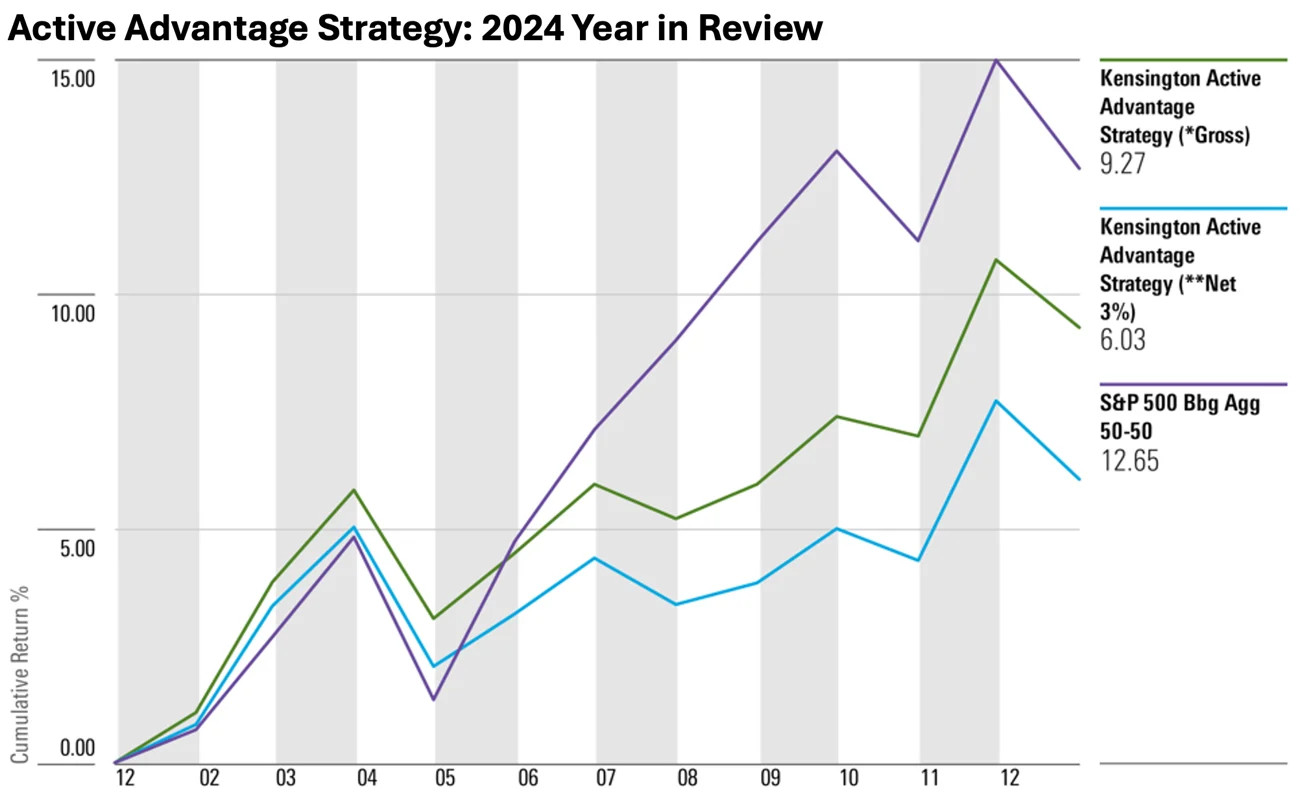
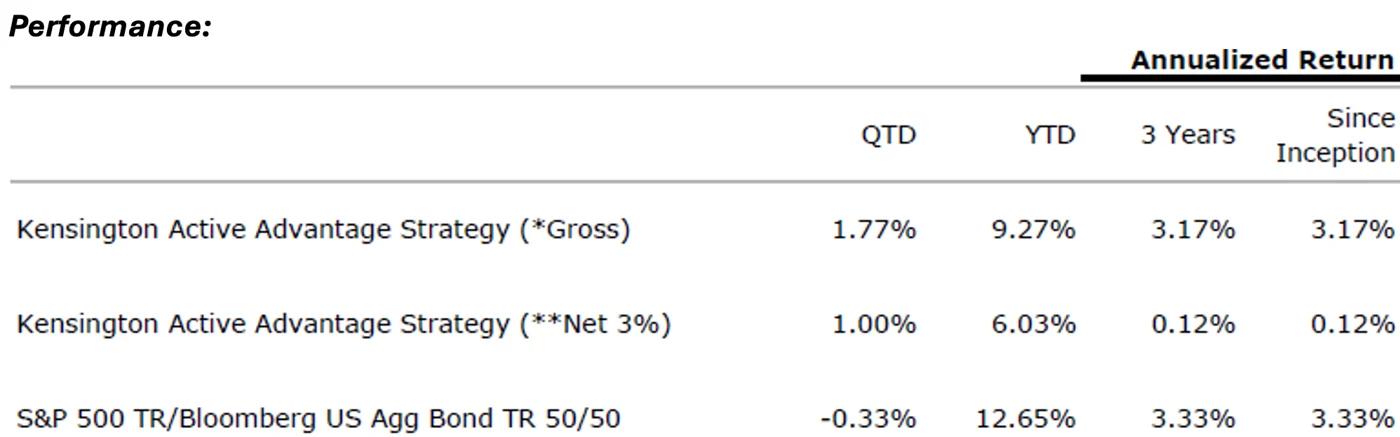
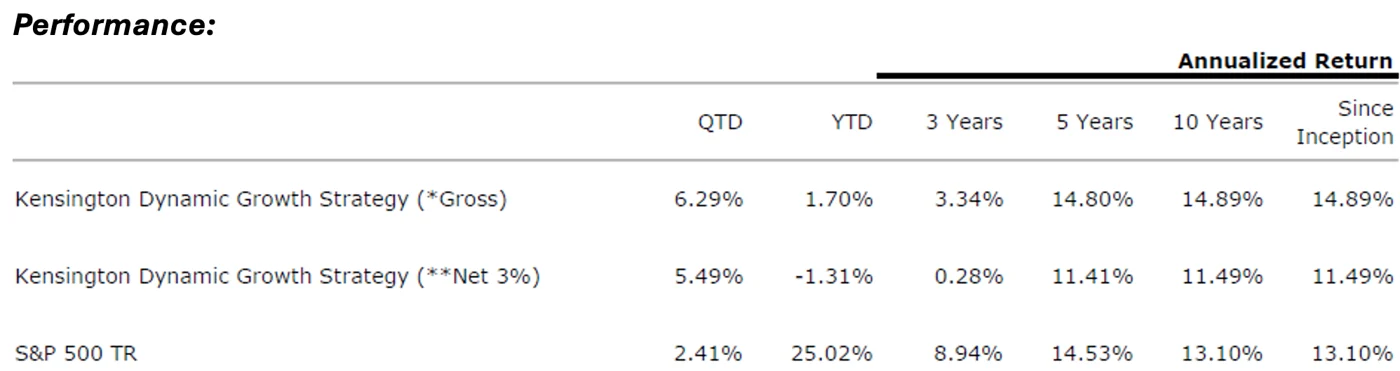
Commentary: In 2024, the Active Advantage Strategy maintained a dynamic “Risk-On” posture, adapting equity and fixed income allocations to evolving market conditions. The Strategy began the year focused on core S&P 500 equities and US High Yield bonds, leveraging early market stability and low volatility. As interest rates climbed, allocations shifted toward floating rate and senior loans, offering attractive risk-reward profiles and reduced equity correlation. Inflation data and Federal Reserve actions significantly influenced positioning, with Active Advantage favoring high yield and investment-grade corporates over duration-sensitive bonds during rising yield environments.
Equity allocations were actively managed to balance growth opportunities and risk mitigation. While maintaining core equity positions, the Strategy made tactical shifts in response to market volatility, such as trimming growth exposures during mid-year declines and emphasizing high-dividend sectors to capture yield and reduce downside risks. Seasonal market turbulence in late summer prompted a cautious reduction in equities and an increase in higher-quality fixed income, enabling resilience during sell-offs. By the fourth quarter, improved market conditions led to measured increases in growth equity and high-yield allocations.
Active Advantage ended the year strongly, benefiting from broad market rallies and reaching an all-time high in November. Fixed income remained concentrated in high yield and floating rate positions, while equities emphasized core S&P 500 exposure with supplemental growth and low-volatility holdings to mitigate risks. Looking ahead, we believe Active Advantage is well-positioned to navigate challenges such as rising yields and narrow market breadth while delivering a balanced, risk-managed approach to capitalizing on equity and fixed income opportunities.
Looking Ahead to 2025
As we move into 2025, many of the larger themes from a year ago remain. Coming into 2024, market participants significantly overestimated the aggressiveness of rate cuts, despite guidance from the Federal Reserve that “higher for longer” was the prevailing theme until the first cut occurred in September. Historically, forward looking equity returns following an initial rate cut of a cycle are mixed, and depend heavily on whether the US economy experiences a recession subsequent to the first cut. Currently, most economists believe there is no imminent threat of a slowdown. However, a reshaping of the yield curve is underway. In September 2024, the 10-year Treasury rate exceeded the 2-year rate, ending a yield curve inversion of over two years, the longest such inversion on record. Historically, recessions, represented by the gray shaded areas on the chart below, often begin at some point after yield curve normalization occurs:
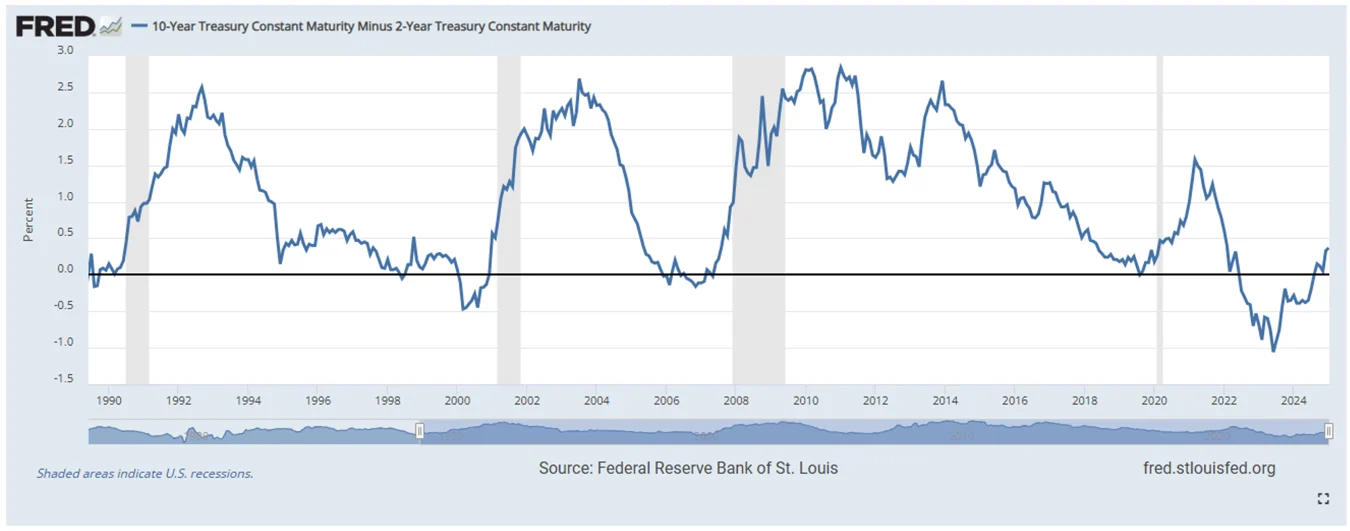
However, while such historical rules of thumb are helpful in assessing the risk of recession, they can often be a poor predictor of exactly when the slowdown begins. Therefore, we believe it is prudent to manage risk while taking advantage of growth opportunities that remain available.
Another theme we are focused on entering 2025 is a possible reinflation trade, as some economists believe inflation could be on the rise in the months and years ahead, harkening back to the inflation patterns of the 1970s. The following chart from Apollo illustrates the possible parallels between these eras:
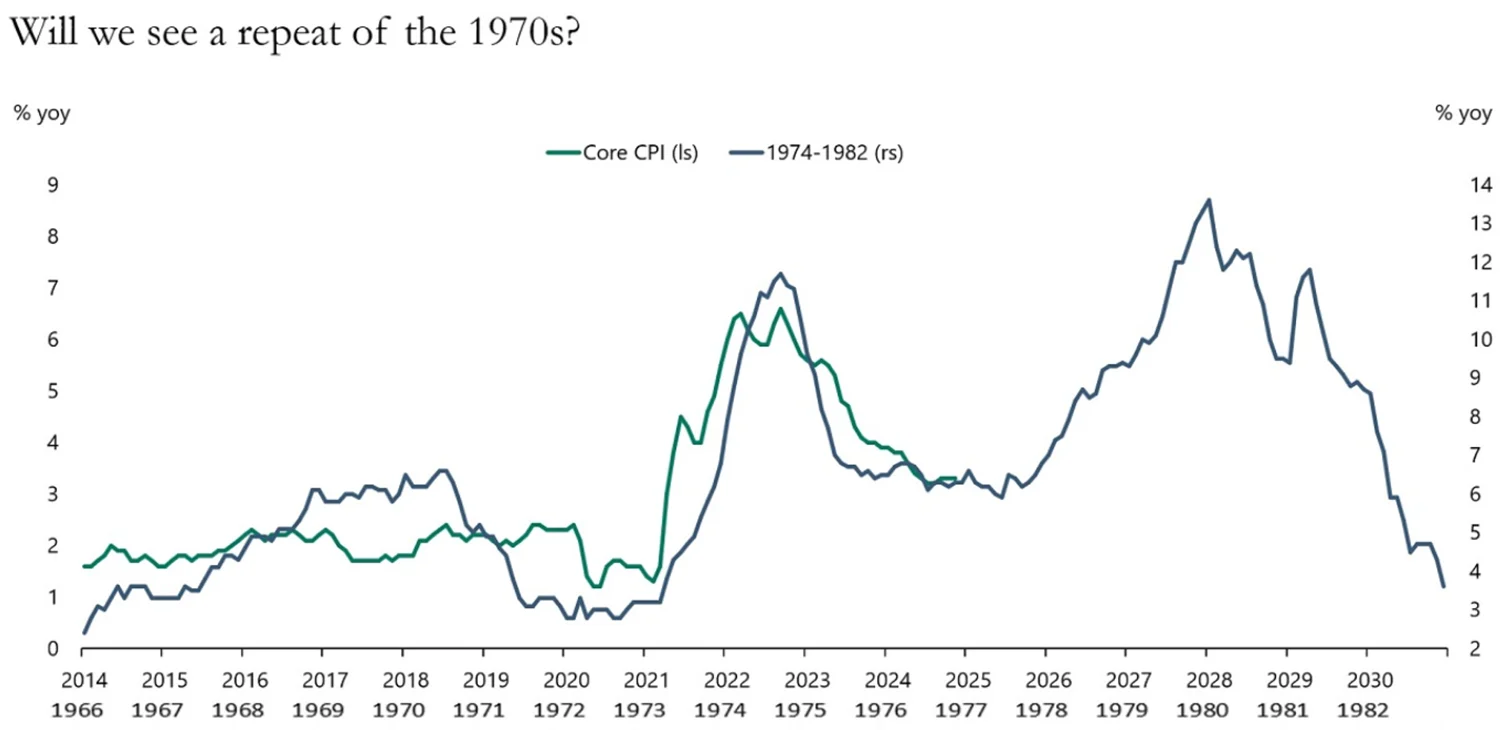
While such analogs often fail to pan out, the threat of reinflation introduces significant implications for investors, including the need to prepare for heightened volatility and a rethinking of traditional strategies, as was the case in 2022.
On the other hand, prospects for equities could remain strong in 2025, should economic and earnings growth continue. The S&P 500 Total Return Index posted over 25% gains in 2023 and 2024, the first back-to-back gains over 25% since 1997 and 1998. Equity markets went on to have another year of gains in 1999, so there is historical precedent for strong growth to continue. However, as was the case during this period of time, equity valuations are relatively expensive, with the S&P 500 forward Price/Earnings ratio at its highest mark since 2020 and second highest mark since the tech bubble peak in 1999.
Looking ahead, we believe understanding these potential scenarios is crucial for investors. Overall, our 2025 playbook is summarized as follows:
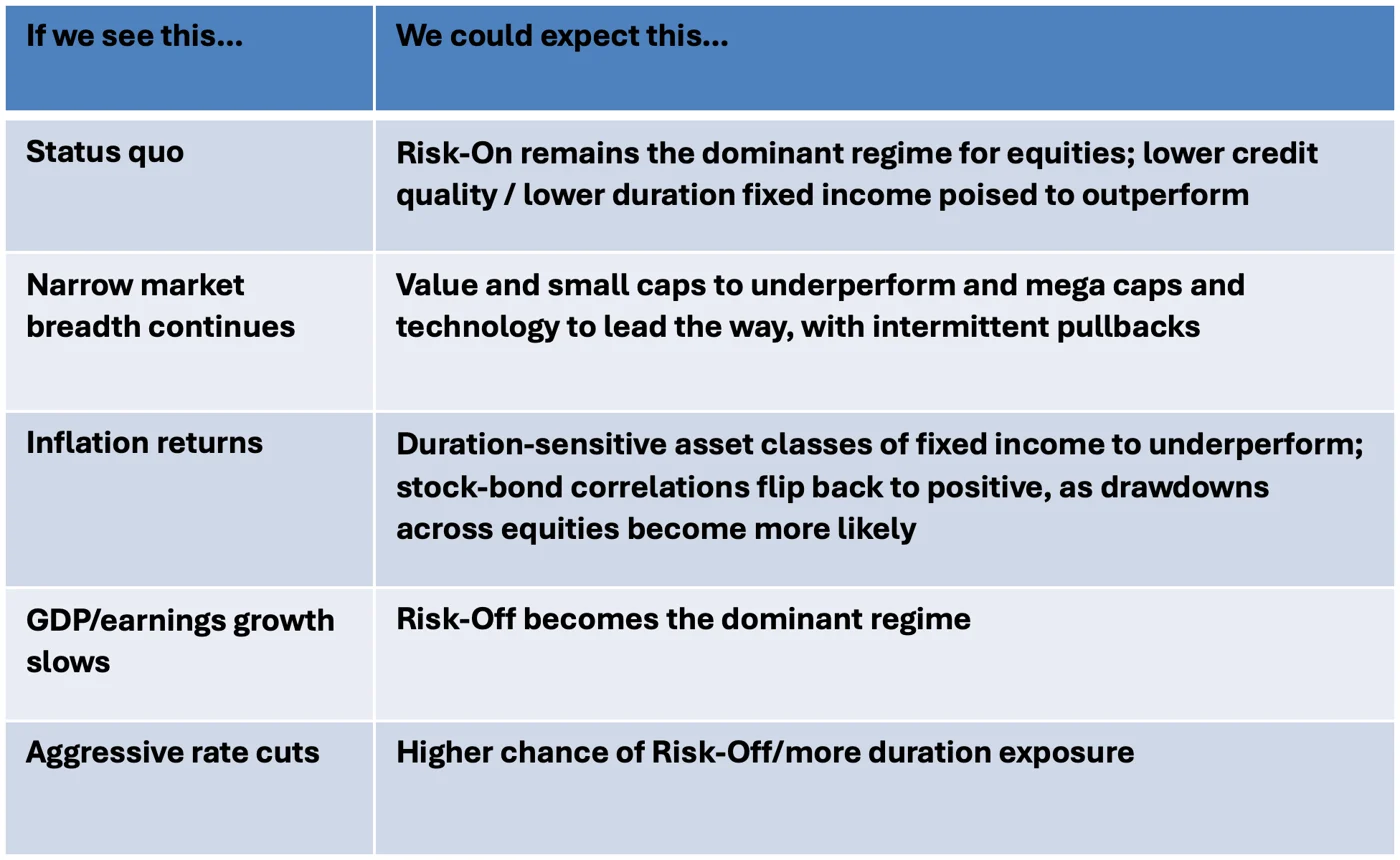
After a strong two-year run in risk assets, the road ahead could be more complex for investors. Historical trends provide valuable context, but navigating this environment requires a flexible, data-driven approach to balance growth opportunities with prudent risk management. Regardless of which of these scenarios present themselves, we believe incorporating an active management approach is vital to navigate the challenges and opportunities of the coming year.
Kensington Portfolio Management Team
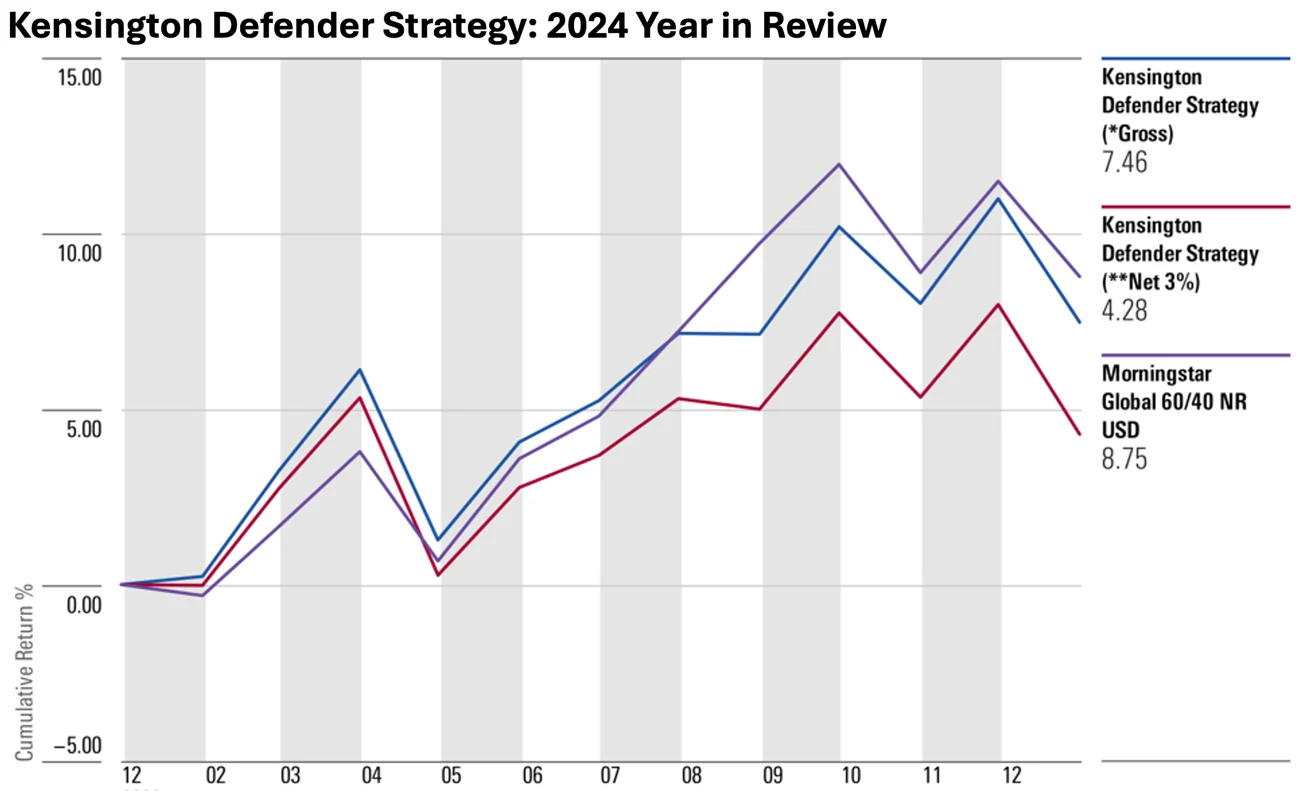
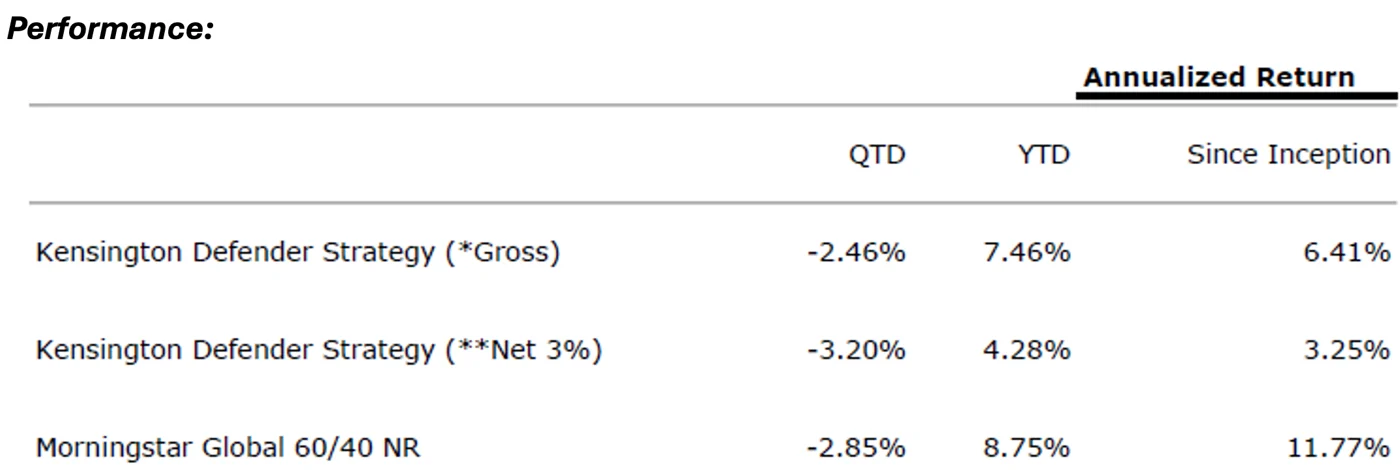
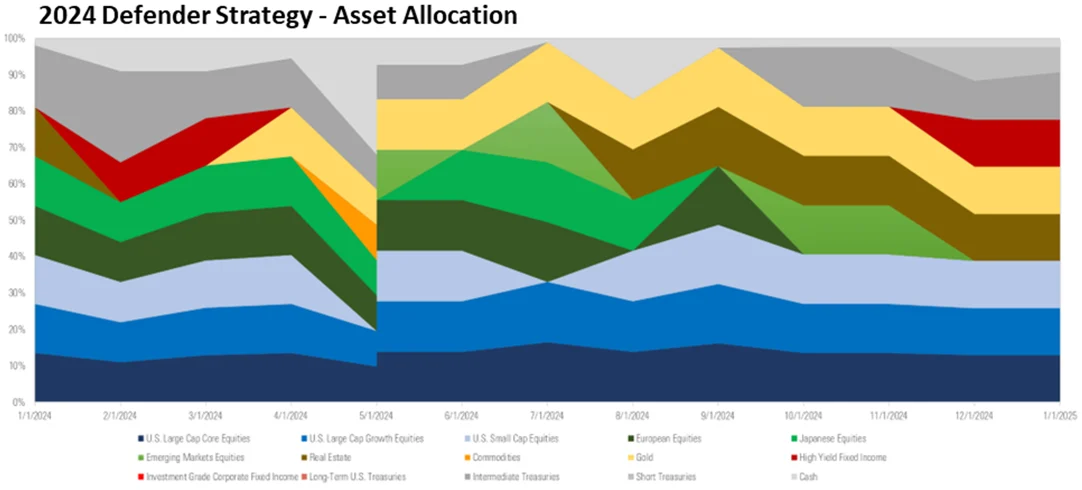
Commentary: In 2024, the Kensington Defender Strategy reaffirmed its commitment to capital preservation and total return, achieving an impressive total return of 7.46% (gross). This performance was underpinned by a diversified portfolio allocation and a disciplined, momentum-based investment strategy. The year presented unique challenges, including historic volatility spikes, narrow equity markets, fluctuating interest rates, and persistent inflationary pressures. Despite these headwinds, the Defender Strategy leveraged its tactical allocation model to dynamically adjust exposure across asset classes, capitalizing on high-performing sectors while mitigating risks in underperforming markets.
The Defender Strategy maintained a well-diversified portfolio throughout the year, with consistent exposure to the S&P 500, Nasdaq 100, and Gold—key drivers of the fund’s strong performance. Additionally, the Strategy intermittently allocated resources to Japan, Europe, Emerging Markets, U.S. Small Caps, and Real Estate. However, these asset classes struggled to establish solid momentum trends, which slightly detracted from overall returns.
A key feature of the strategy in 2024 was its continued delivery of consistent quarterly income distributions, catering to income-focused investors seeking reliable payouts alongside capital appreciation. This was achieved through an options overlay within the portfolio, which contributed to solid total returns and provided tax-advantaged distributable income.
The fund’s momentum-based approach, combined with active risk management, effectively navigated market downturns. By employing stop-loss mechanisms and reallocating assets, when necessary, the Strategy minimized drawdowns and preserved investor capital.
Looking Ahead to 2025
As the global economy transitions into 2025, the Kensington Defender Strategy is well-positioned to adapt to shifting market conditions. The US economy is expected to decelerate, with real GDP growth projected to slow from approximately 3% to around 2%. This slowdown is attributed to emerging policy risks, including trade tariffs and stricter immigration policies, which may also exert upward pressure on inflation. Analysts anticipate a “soft landing” for the US economy, suggesting stabilization after prior economic fluctuations. Core inflation in the US is expected to remain at or above 2.5% throughout 2025. Consequently, while the Federal Reserve may reduce its policy rate to 4%, further cuts could be limited by ongoing inflationary pressures. Higher starting yields have improved the risk-return trade-off in fixed-income markets, reflecting gradual normalization in policy rates and yield curves, though near-term risks persist.
While the global economy is poised for continued growth in 2025, regional and sectoral disparities underscore the importance of strategic diversification and vigilant monitoring of policy developments. The Kensington Defender Strategy, with its flexible investment mandate and focus on capital preservation, offers a balanced approach to growth and risk mitigation. It remains a reliable choice for investors seeking a blend of capital preservation and total return.
Elio Chiarelli, Jr., PhD, AIF®, CPFA®
Portfolio Manager
Liquid Strategies, LLC
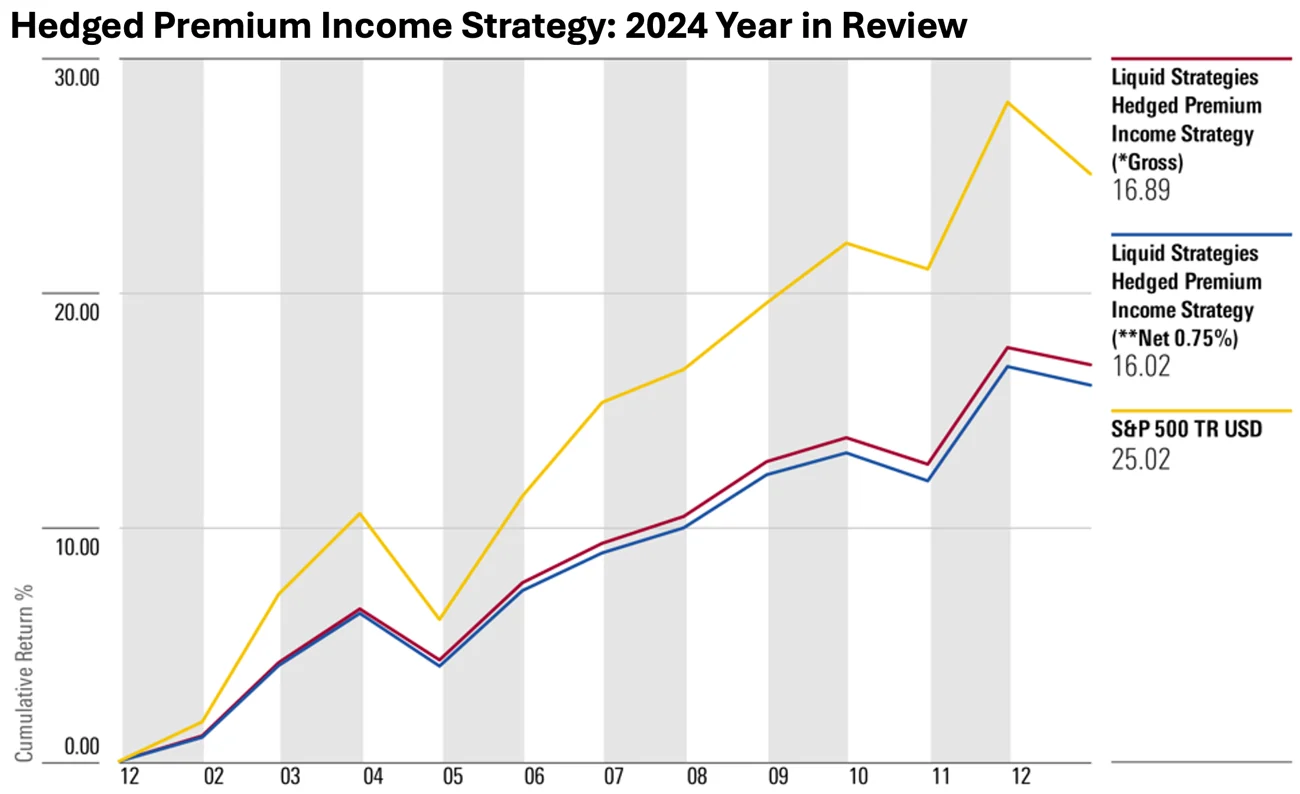

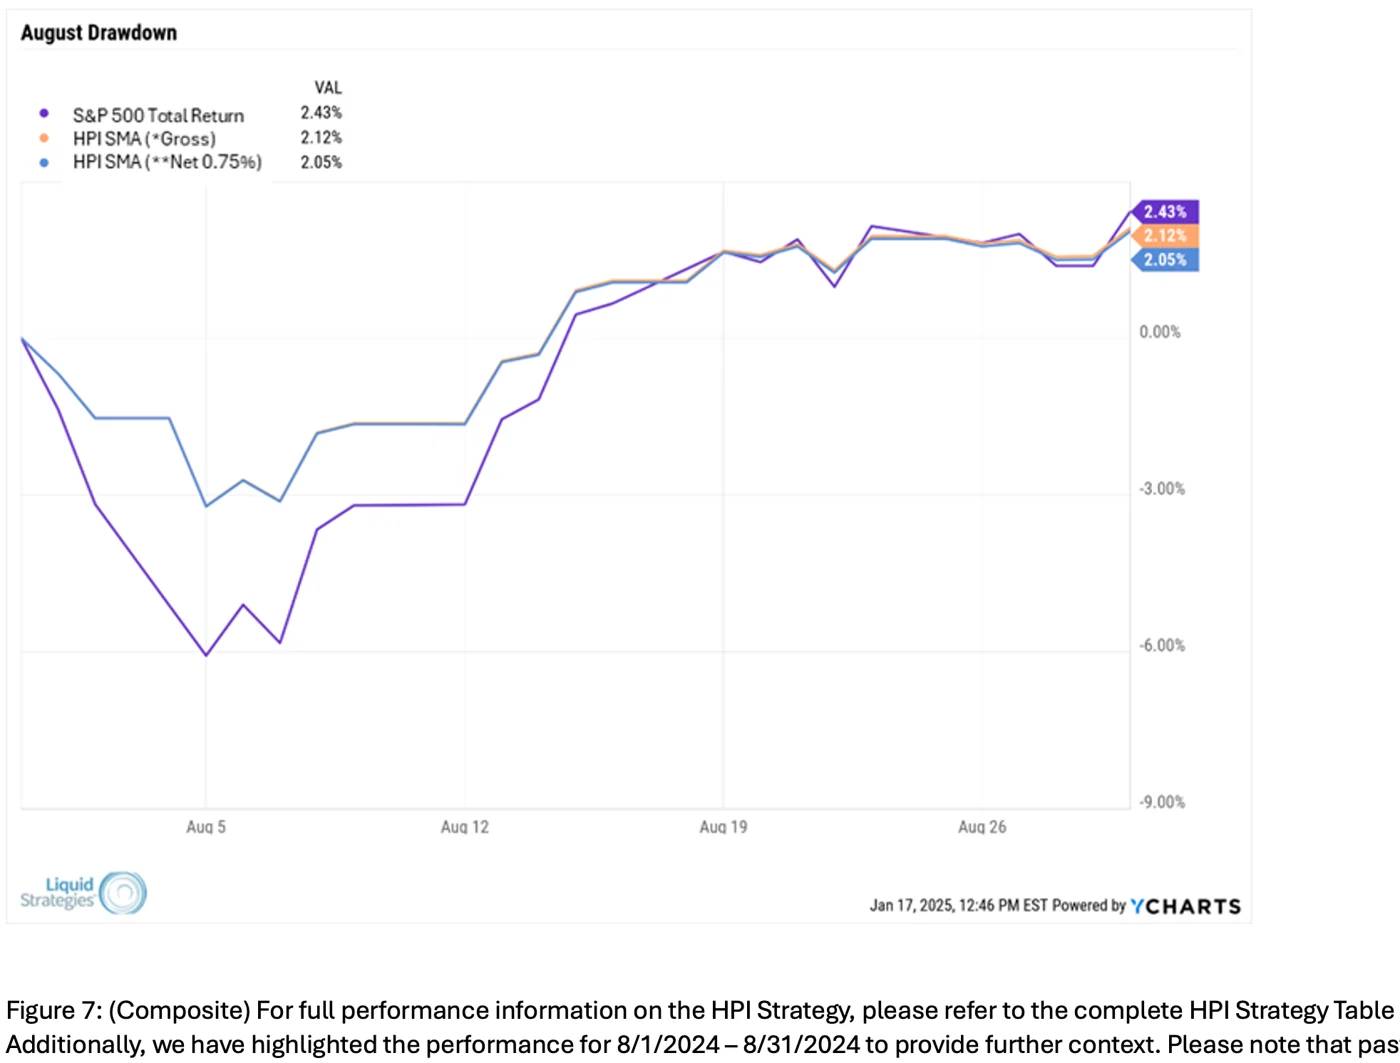
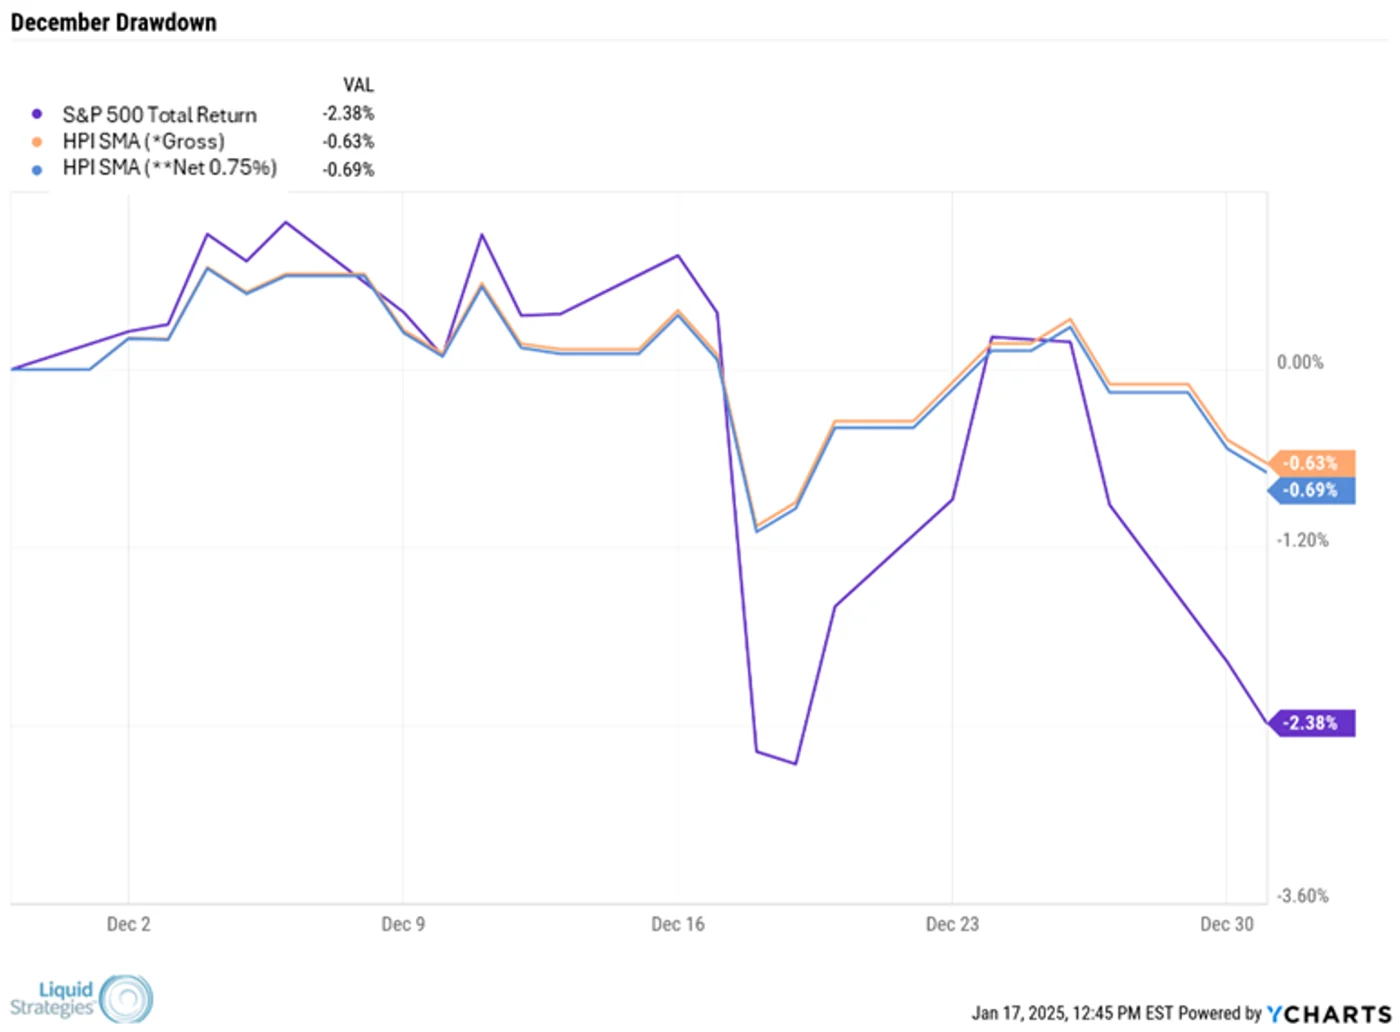
Commentary: Despite several volatility flare ups, including one of the largest in history during the month of August, the Hedged Premium Income Strategy delivered a positive net total return of 15.87%. This compares very favorably to other popular income strategies such as High Yield (+8.19%), Preferred Equities (+2.10%), and REITs (+4.29%). In addition to providing a solid total return, the Strategy accumulated approximately 11.74% in tax-advantaged distributable income based on about 10.43% in net option premiums (the difference between the premiums collected from the option writing program and the premiums paid for the downside hedges) and 1.31% in dividends paid by the core VOO (Vanguard 500 Index Fund ETF) holding. A key feature for the Strategy is the low sensitivity to interest rates. The total return and income were achieved despite the 10-year Treasury Yield jumping from 3.67% at the end of 2023 to 4.57% to close out 2024.
Due to the Strategy’s conservative all-weather approach, it is expected to lag the S&P 500 Index in sharply higher years. 2024 was no exception as the S&P 500 Total Return Index was up 25.02%. However, investors in the Strategy benefit not only from the income generation, but also the downside risk management. During the two primary volatility spikes (early August and late December), the Strategy held up significantly better than the equity market due to a combination of the income collected and the value provided by the downside protection. During the course of the year, the S&P 500 Index had a max drawdown of 8.45% compared to only 4.03% for the Hedged Premium Income Strategy. Furthermore, the Strategy had about half the volatility of the S&P 500 Index.
Looking Ahead to 2025
With the exception of a few brief volatility spikes, the equity markets have been relatively quiet the past couple of years. Looking ahead to 2025, there are multiple factors that could drive volatility higher: 1) concerns about extended equity valuations, particularly in the “Magnificent 7” that represents a significant portion of the index weighting, could lead investors to reduce equity weightings; 2) inflation could move higher again in response to renewed growth and price impacts from policy changes with the new administration; and 3) new or increased geopolitical risks that generate short to intermediate term volatility. Inflation/interest rate risk appears to be top of mind for investors. As the chart below details, interest rates have moved sharply higher since the election, indicating the market is pricing in higher long-term inflation.
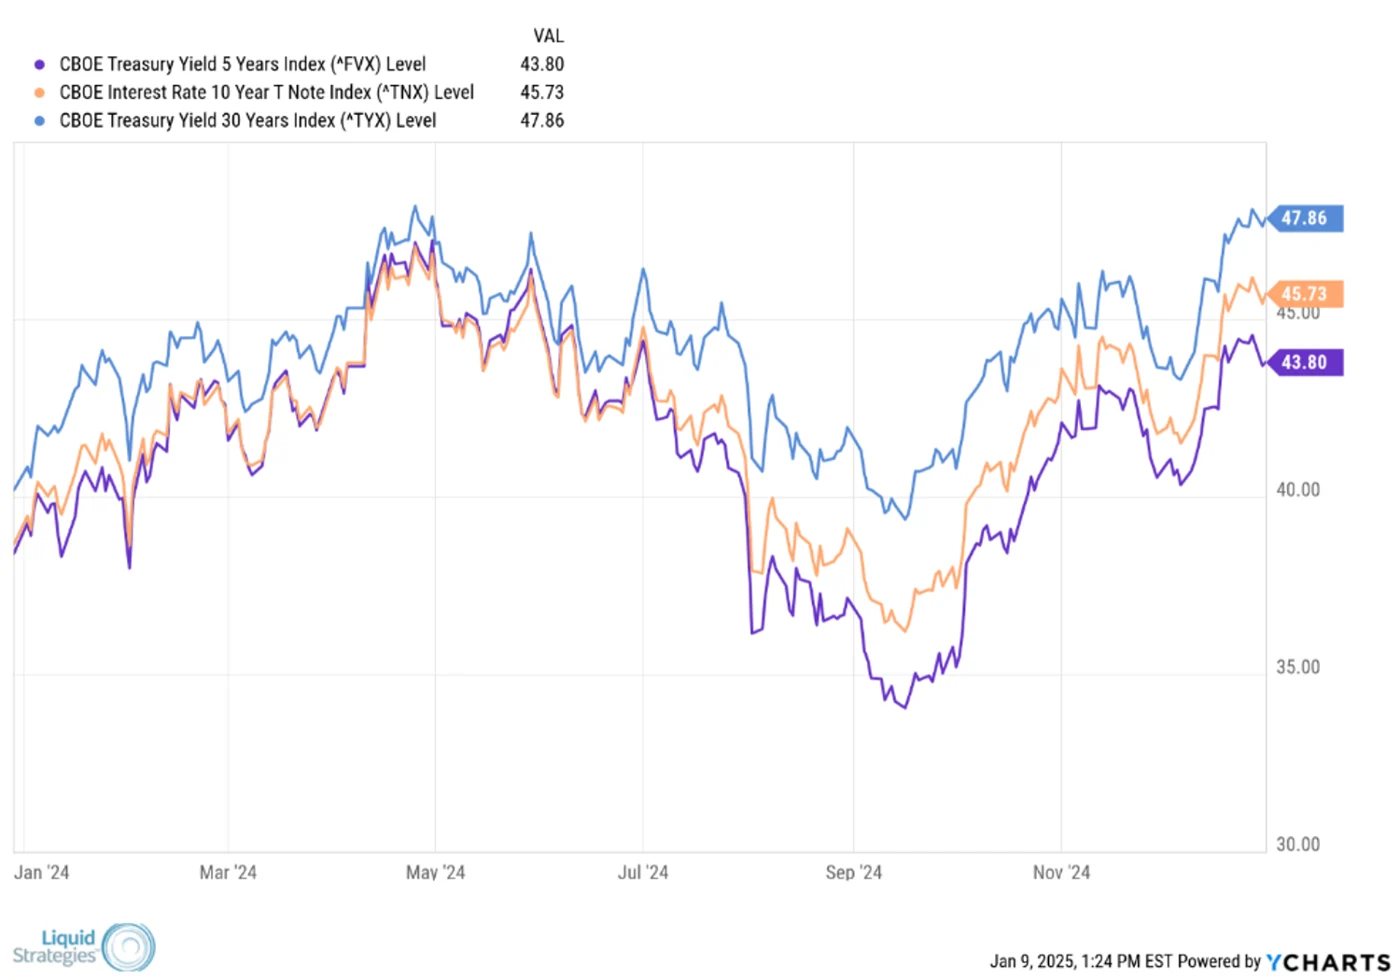
A jump in inflation combined with a corresponding reversal of FOMC interest rate easing could spell trouble for both equity and bond markets similar to what was experienced in 2022. Fortunately for investors in the Hedged Premium Income Strategy, the Strategy is designed to add value in a variety of markets and having constant downside hedges in place helps to mitigate these potential risks while still allowing for an attractive yield and growth potential.
Shawn Gibson
CIO, Lead Portfolio Manager
Liquid Strategies
Disclaimers:
Investing involves risk, including loss of principal. Past performance does not guarantee future results. There is no guarantee any investment strategy will generate a profit or prevent a loss.
This is for informational purposes only and is not a recommendation nor solicitation to buy, sell or invest in any investment product or strategy. Our materials may contain information deemed to be correct and appropriate at a given time but may not reflect our current views or opinions due to changing market conditions. No information provided should be viewed as or used as a substitute for individualized investment advice. An investor should consider the investment objectives, risks, charges, and expenses of the investment and the strategy carefully before investing.
Kensington Asset Management, LLC (“KAM”) relies on third party sources for some of its information that we believe is reliable. However, we make no representation, warranty, endorse or affirm as to its accuracy or completeness. The information provided is current as of the date of publication and may be subject to change. We are not responsible for updating this information to reflect any subsequent developments or events.
Any indices and other financial benchmarks shown are provided for illustrative purposes only, are unmanaged, reflect reinvestment of income and dividends and do not reflect the impact of advisory fees. Investors cannot invest directly in an index. Comparisons to indexes have limitations because indexes have volatility and other material characteristics that may differ from a particular strategy such as the types of securities being substantially different.
Certain information contained herein constitutes “forward-looking statements,” which can be identified using forward-looking terminology such as “may,” “will,” “should,” “expect,” “anticipate,” “project,” “estimate,” “intend,” “continue,” or “believe,” or the negatives thereof or other variations thereon or comparable terminology. Due to various risks and uncertainties, actual events, results, or actual performance may differ materially from those reflected or contemplated in such forward-looking statements. Nothing contained herein may be relied upon as a guarantee, promise, assurance, or a representation as to the future.
Advisory services offered through Kensington Asset Management, LLC (“KAM”), Barton Oaks Plaza, Bldg II, 901 S Mopac Expy – Ste 225, Austin, TX 78746. Hedged Premium Income Strategy is managed by Liquid Strategies, LLC (“LS”). Defender Strategy is managed by LS through a sub-advisory agreement with KAM. KAM and LS are not affiliated
Managed Income Strategy
KAM claims compliance with the Global Investment Performance Standards (GIPS®). KAM has been independently verified for the period of January 1, 2008 through December 31, 2023.
The lead manager primarily responsible for achieving prior performance began managing this strategy on 12/31/2007 and has continued this strategy at several firms in the same capacity prior to KAM. Additionally, the accounts managed and the investment process employed for this strategy at the prior firms remain substantially similar. Therefore, KAM uses 12/31/07 as the inception date for the Managed Income Strategy. Kensington Managed Income was formerly referred to as High Yield Bond Strategy. The name of the organization was formerly known as KAM until 09/24/2012 and then as Kensington Analytics until 8/14/2020 before re-assuming the KAM name.
The Composite was created and incepted in January 2008 and only includes accounts with a minimum of $100K. GIPS® is a registered trademark of CFA Institute. CFA Institute does not endorse or promote this organization, nor does it warrant the accuracy or quality of the content contained herein. Results are based on fully discretionary accounts under management, including those accounts no longer with the Firm. The U.S. Dollar is the currency used to express performance. An investment in securities involves risk, including loss of principal. Returns are presented net of fees and include the reinvestment of all income. Performance represents past performance.
The Managed Income Strategy uses the Bloomberg Barclays US Aggregate Bond Index as its benchmark, as this index is, in KAM’s view, a representative index for the broader fixed income market. The Bloomberg U.S. Aggregate Bond Index is a market capitalization-weighted intermediate term index which tracks the performance of investment grade rated debt publicly traded in the United States.
Risks specific to the Managed Income Strategy include Management Risk, High-Yield Risk, Fixed-Income Security Risk, Foreign Investment Risk, Loans Risk, Market Risk, Underlying Funds Risk, Non-Diversification Risk, Turnover Risk, US Government Securities Risk, LIBOR Risk, Models and Data Risk.
Dynamic Growth Strategy
KAM claims compliance with the Global Investment Performance Standards (GIPS®). KAM has been independently verified for the period of January 1, 2015 through December 31, 2023.
The lead manager primarily responsible for achieving prior performance began managing this strategy on 12/31/2014 and has continued this strategy at several firms in the same capacity prior to being managed at KAM effective 10/23/20. The accounts managed and the investment process employed for this strategy at the prior firms remain substantially similar. Therefore, KAM uses 12/31/14 as the inception date for the Dynamic Growth Strategy. Kensington Dynamic Growth was formerly referred to as Nasdaq Unconstrained Growth Tactical Allocation Model from inception through June 2020, and the Enhanced Equity Strategy from June 2020 to July 2020.
The Composite was created and incepted in January 2015 and only includes accounts with a minimum of $100k. GIPS® is a registered trademark of CFA Institute. CFA Institute does not endorse or promote this organization, nor does it warrant the accuracy or quality of the content contained herein. Results are based on fully discretionary accounts under management, including those accounts no longer with the firm. The U.S. Dollar is the currency used to express performance. An investment in securities involves risk, including loss of principal. Returns are presented net of fees and include the reinvestment of all income.
The Dynamic Growth Strategy uses the S&P 500 TR Index as its benchmark, as this index is, in KAM’s view, a representative index for the broader equity market. The S&P 500 TR Index is a capitalization weighted index of 500 stocks representing all major domestic industry groups. The S&P 500 TR Index assumes the reinvestment of dividends and capital gains.
Risks specific to the Dynamic Growth Strategy include Management Risk, Equity Securities Risk, Market Risk, Underlying Funds Risk, Non- Diversification Risk, Small and Mid-Capitalization Companies Risk, Turnover Risk, US Government Securities Risk, Models and Data Risk.
Active Advantage Strategy
Kensington Asset Management claims compliance with the Global Investment Performance Standards (GIPS®). Kensington Asset Management has been independently verified for the period of January 1, 2022 through December 31, 2023. Inception calculation based on the inception date: 1/1/2022.
The Composite was created and incepted in January 2022 and only includes accounts with a minimum of $100K. GIPS® is a registered trademark of CFA Institute. CFA Institute does not endorse or promote this organization, nor does it warrant the accuracy or quality of the content contained herein. Results are based on fully discretionary accounts under management, including those accounts no longer with the Firm. The U.S. Dollar is the currency used to express performance. An investment in securities involves risk, including loss of principal. Returns are presented net of fees and include the reinvestment of all income. Performance represents past performance.
The Active Advantage Strategy uses a 50/50 blend of the S&P 500 TR Index and the Bloomberg US Aggregate Bond Index. In KAM’s view, these indices serve as representative indices for the broader fixed income and equity markets. Weightings were chosen to represent the Strategy’s balanced nature when fully invested. The Bloomberg U.S. Aggregate Bond Index is a market capitalization-weighted intermediate term index which tracks the performance of investment grade rated debt publicly traded in the United States. The S&P 500 TR Index is a capitalization weighted index of 500 stocks representing all major domestic industry groups. The S&P 500 TR Index assumes the reinvestment of dividends and capital gains.
Risks specific to the Active Advantage Strategy include Management Risk, Equity Securities Risk, High-Yield Risk, Fixed-Income Security Risk, Foreign Investment Risk, Loans Risk, Market Risk, Underlying Funds Risk, Limited History of Operations Risk, Non-Diversification Risk, Small and Mid-Capitalization Companies Risk, Turnover Risk, US Government Securities Risk, LIBOR Risk, Models and Data Risk.
Hedged Premium Income (HPI) Strategy
The Strategy invests in options that derive their performance from the performance of the S&P 500 Index. Selling (writing) and buying options are speculative activities and entail greater than ordinary investment risks. The Strategy’s use of put options can lead to losses because of adverse movements in the price or value of the underlying asset, which may be magnified by certain features of the options. When selling a put option, the Strategy will receive a premium; however, this premium may not be enough to offset a loss incurred by the Strategy if the price of the underlying asset is below the strike price by an amount equal to or greater than the premium. Purchased put options may expire worthless and the Strategy would lose the premium it paid for the option. The Strategy may lose significantly more than the premiums it receives in highly volatile market conditions.
The Strategy will invest in short term put options which are financial derivatives that give buyers the right, but not the obligation, to sell (put) an underlying asset at an agreed-upon price and date. The Strategy’s use of options may reduce the Strategy’s ability to profit from increases in the value of the underlying asset. The Strategy could experience a loss or increased volatility if its derivatives do not perform as anticipated or are not correlated with the performance of their underlying asset or if the Strategy is unable to purchase or liquidate a position.
The HPI Strategy is managed by subadvisor, Liquid Strategies, LLC (“LS”). Additional information about the Strategy and the adviser can be obtained by viewing company disclosure documents available upon request.
HPI Strategy performance information presented herein is based on data provided by LS, a subadvisor to our Firm. We have relied on LS to ensure the accuracy and completeness of this information. While we believe this data to be accurate, we cannot guarantee its accuracy or completeness and are not responsible for any errors or omissions in the information provided by LS.
Defender Strategy
Kensington Asset Management claims compliance with the Global Investment Performance Standards (GIPS®). Kensington Asset Management has been independently verified for the period of June 1, 2023 through December 31, 2023. Inception calculation based on the inception date: 6/1/2023.
The Composite was created and incepted in June 2023 and only includes accounts with a minimum of $100K. GIPS® is a registered trademark of CFA Institute. CFA Institute does not endorse or promote this organization, nor does it warrant the accuracy or quality of the content contained herein. Results are based on fully discretionary accounts under management, including those accounts no longer with the Firm. The U.S. Dollar is the currency used to express performance. An investment in securities involves risk, including loss of principal. Returns are presented net of fees and include the reinvestment of all income. Performance represents past performance.
Risks specific to the Defender Strategy include General Market Risk, Credit Risk, Interest Rate Risk, Management Risk, Equity Securities Risk, Fixed-Income Securities Risk, High-Yield Bond Risk, Foreign Investment Risk, Emerging Markets Risk, Real Estate and REITs Risk, Commodities Risk, Currency Risk, Subsidiary Risk, Market Risk, Underlying Funds Risk, Derivatives Risk, Limited History of Operations Risk, Turnover Risk, Models and Data risk, Momentum Risk or risk of the portfolio not performing as expected.
The Defender Strategy uses a 60/40 blend of the Morningstar Global Markets Net Return USD (60%) and Morningstar Global Core Bond Gross Return USD (40%), rebalanced to target weights of 60% equity and 40% fixed income on a monthly basis (Morningstar Global 60/40 Index). In KAM’s view, this is a representative index for the broader global fixed income and equity markets. Weightings were chosen to represent the Strategy’s balanced nature when fully invested. The Morningstar Global Markets Index is a comprehensive benchmark that represents the performance of the global equity market covering approximately 97% of the investable market capitalization across 49 countries. The Morningstar Global Core Bond index is a comprehensive benchmark that reflects the performance of the global core bond market covering a broad range of liquid bonds from various regions and sectors. The types of securities held by a comparison benchmark may be substantially different from the investment strategy. It is not possible to invest in an index, and index returns do not include management fees.
The Kensington Defender Strategy is managed by Kensington Asset Management, LLC and sub-advised by Liquid Strategies, LLC. Additional information about the Strategy and the adviser can be obtained by viewing company disclosure documents available upon request.
Definitions:
Bloomberg U.S. Aggregate Bond Index: A market capitalization-weighted intermediate term index which tracks the performance of investment grade rated debt publicly traded in the United States.
CBOE Treasury Yield 5Y Index: Tracks the yield of U.S. Treasury securities with a maturity of five years, providing a benchmark for the performance of mid-term government bonds.
CBOE Treasury Yield 10Y T Note Index: Measures the yield of U.S. Treasury notes with a maturity of ten years, serving as a key indicator of long-term interest rates and economic expectations.
CBOE Treasury Yield 30Y Index: Reflects the yield of U.S. Treasury bonds with a maturity of thirty years, often used as a benchmark for long-term interest rates and inflation expectations.
Morningstar Global Markets Index: A comprehensive benchmark that represents the performance of the global equity market, covering approximately 97% of the investable market capitalization across 49 countries.
Morningstar Global Core Bond Index: A comprehensive benchmark that reflects the performance of the global core bond market covering a broad range of liquid bonds from various regions and sectors.
NASDAQ 100 Index: A market index that comprises of the one hundred largest, most actively traded companies listed on the Nasdaq stock exchange.
S&P 500 Total Return: A capitalization weighted index of 500 stocks representing all major domestic industry groups. The S&P 500 TR Index assumes the reinvestment of dividends and capital gains.
Related Perspectives
View All-
Monthly Market Commentary – February 2026
Risk assets delivered mixed but generally positive results in November as investors weighed softer labor data, the ongoing government shutdown, and the prospect of another Federal Reserve rate cut in December.
-
Strategy Review – February 2026
Risk assets delivered mixed but generally positive results in November as investors weighed softer labor data, the ongoing government shutdown, and the prospect of another Federal Reserve rate cut in December.
