AI Enthusiasm
Monthly Market Commentary
By Kensington Asset Management Team
Geopolitics
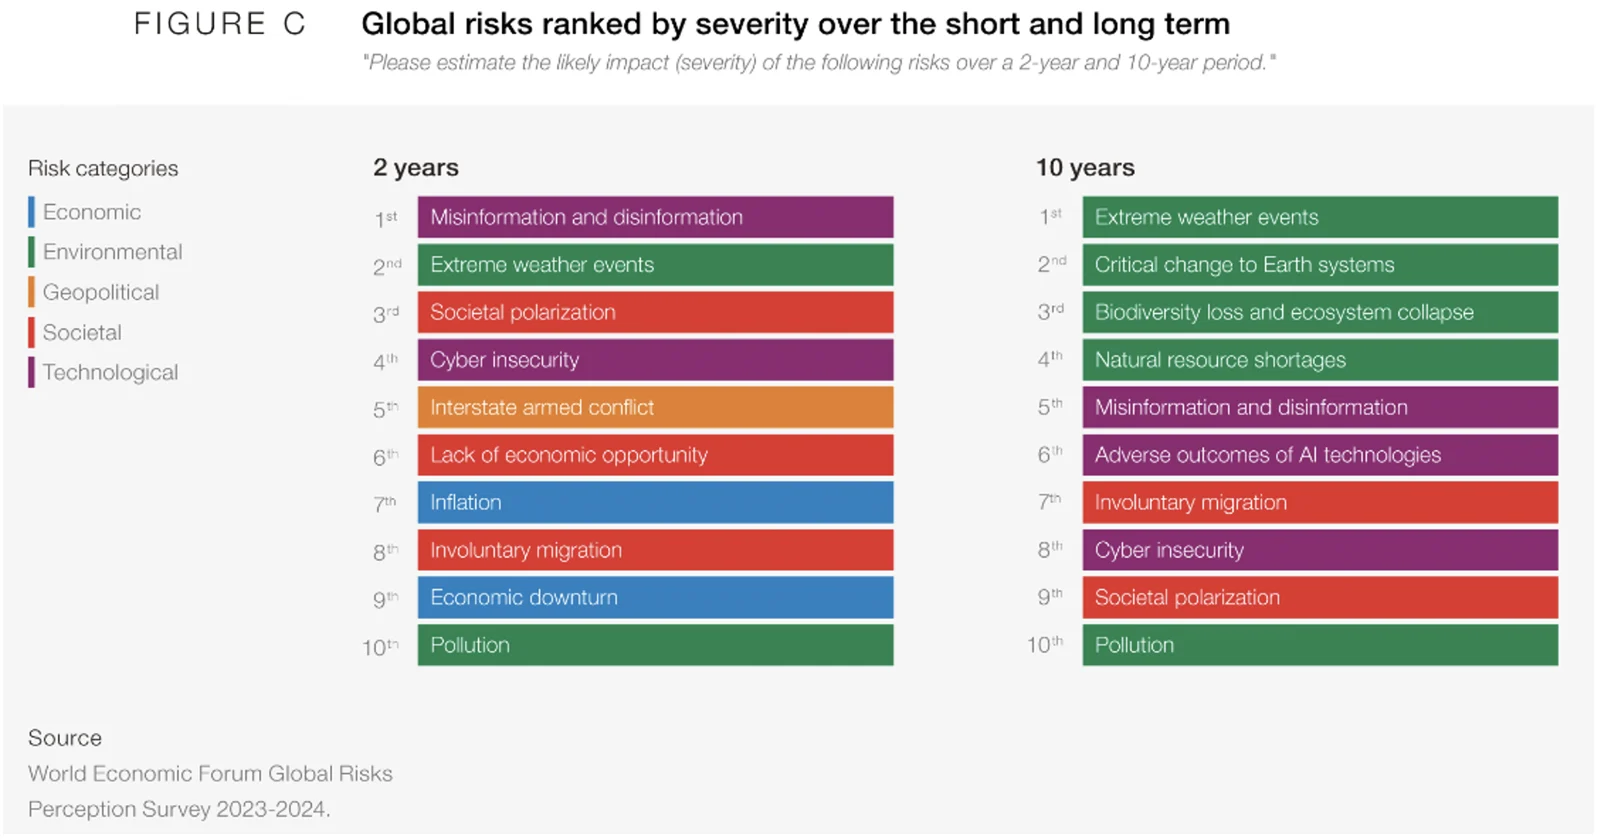
Earlier this year, the World Economic Forum (WEF) published the 19th edition of its Global Risk Reports. The report “highlights the findings from the WEF’s annual Global Risks Perception Survey, which brings together the collective intelligence of nearly 1,500 global leaders across academia, business, government, the international community, and civil society. It also leverages insights from over 200 thematic experts”.
The report looks at global risks from both a short-term (2-year horizon) and long-term (10-year) perspective and attempts to rank them in order of severity. This year Survey respondents view the #1 risk over the next two years as “misinformation and disinformation”, believing there is a very high likelihood foreign and domestic actors will leverage misinformation and disinformation to widen societal and political divides. This comes as no surprise but what may be underappreciated by many is the close proximity in time: three billion people are expected to head to the electoral polls across several economies – including Bangladesh, India, Indonesia, Mexico, Pakistan, the United Kingdom, and the United States – over the next two years.
Stock market
Markets advanced strongly in February with all major domestic indices gaining over 5%. The S&P 500 was up 5.17%, the Nasdaq 100 positive 5.29%, the small-cap Russell 2000 jumped 5.52% and the MSCI EAFE, a still healthy 3.03%.
Animal spirits were in clear evidence as beneficiaries of the AI enthusiasm continued to attract investor capital, spurred on by earnings beats and increasingly positive demand forecasts by managements. Earnings beats weren’t limited to the technology sector, however. With 99% of the S&P 500 companies reporting for Q4 2023, fully 73% of the companies delivered earnings surprises to the upside and 64% positive revenue surprises.
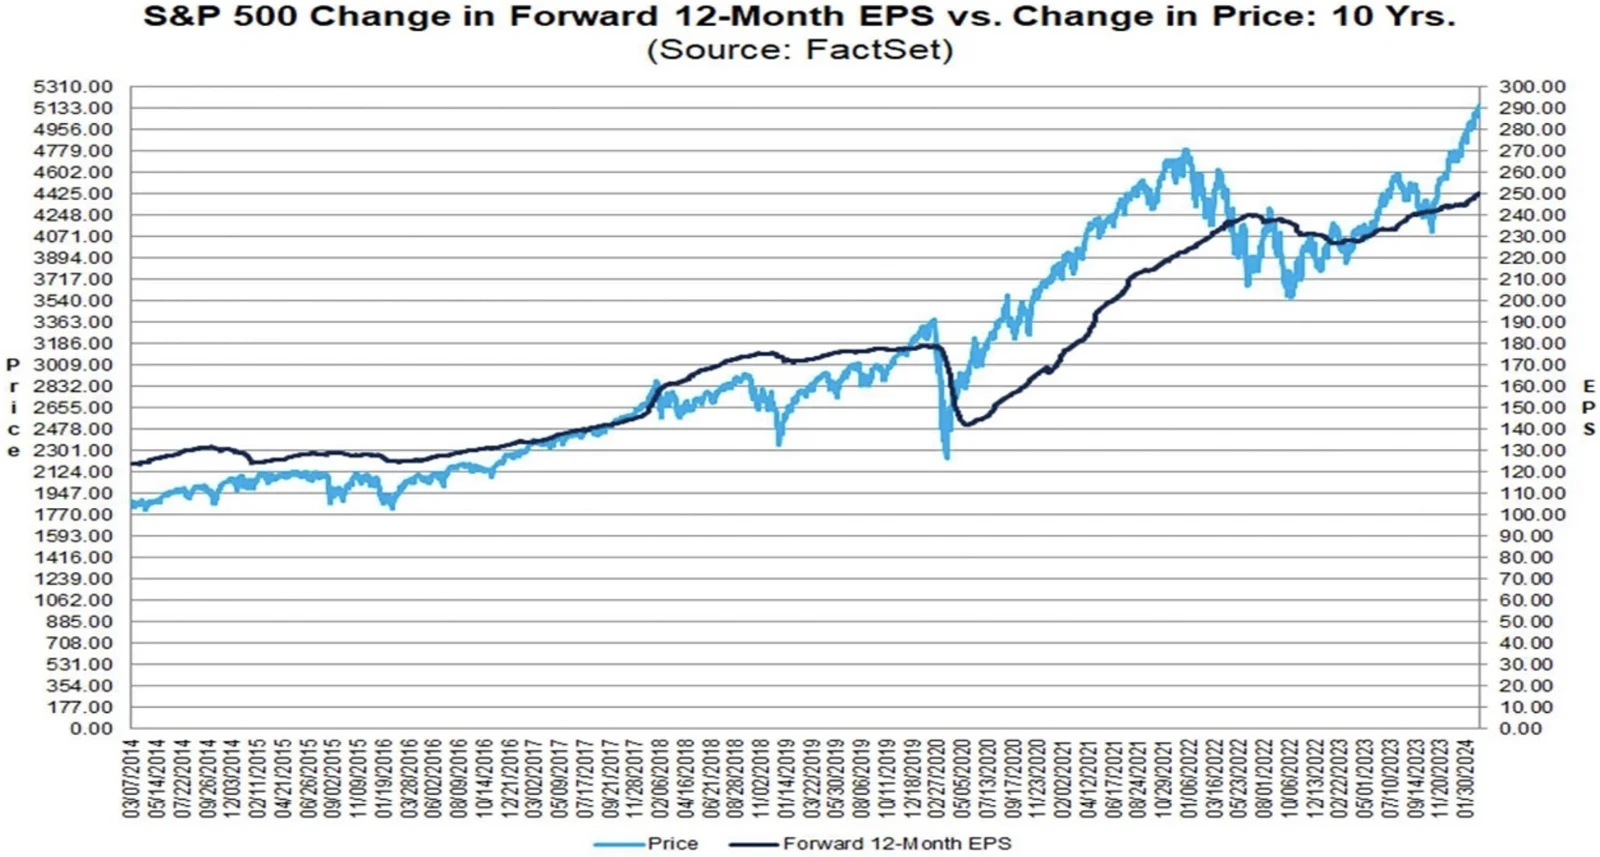
Stepping back, the question is whether after a nearly 50% advance off the October 2022 lows, the good news on the earnings front is already baked into prices. As can be seen in the graph below, there is now a wide gap between the Street’s earnings forecast for the S&P 500 over the next twelve months and the index’s current price. There is nothing here that mandates a price correction, only to suggest the margin of safety provided by at least this valuation measure is historically noticeably lower than the 10-year average.
Speaking of revenue surprises, it has been the healthy increase in sales that has driven earnings gains as operating earnings margins have remained pinned around 12%. When the Federal Reserve began raising rates in 2022 amid rising inflation (higher input costs), one of the market’s major concerns was the potential negative impact on corporate profit margins. So far, however, that fear hasn’t materialized as consumers have acceded to higher purchase prices, if grudgingly. Of course, the drivers of higher revenues are unit growth and price growth. This is why the recent uptick in productivity has been enthusiastically welcomed by investors with the hope that the integration of artificial intelligence tools in the years ahead will result in a secular uptrend in this measure.
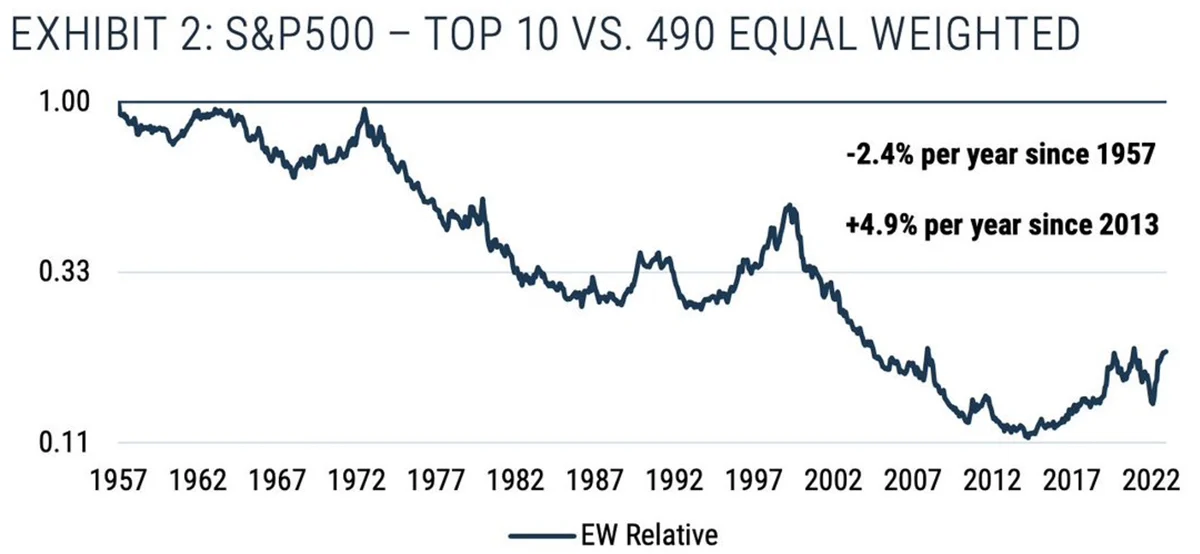
Like many others, we have commented in the recent past about the performance of the capitalization-weighted S&P 500 index relative to its lesser-known cousin, the equal weighted index. Given what is by many measures, the extreme performance by the top weighted stocks in the index, it’s often helpful to look at relative performance between these two from a longer-term perspective. As illustrated by the chart below, it’s not unusual for the top performers to enjoy long periods of outperformance. But if history is a guide (admitting the sample set is extremely small), it suggests we should start to see a shift in the not-too-distant future into the relative laggards. The exact timing of such shifts is always problematic, but it’s probable that this trend is now getting rather old by historical standards.
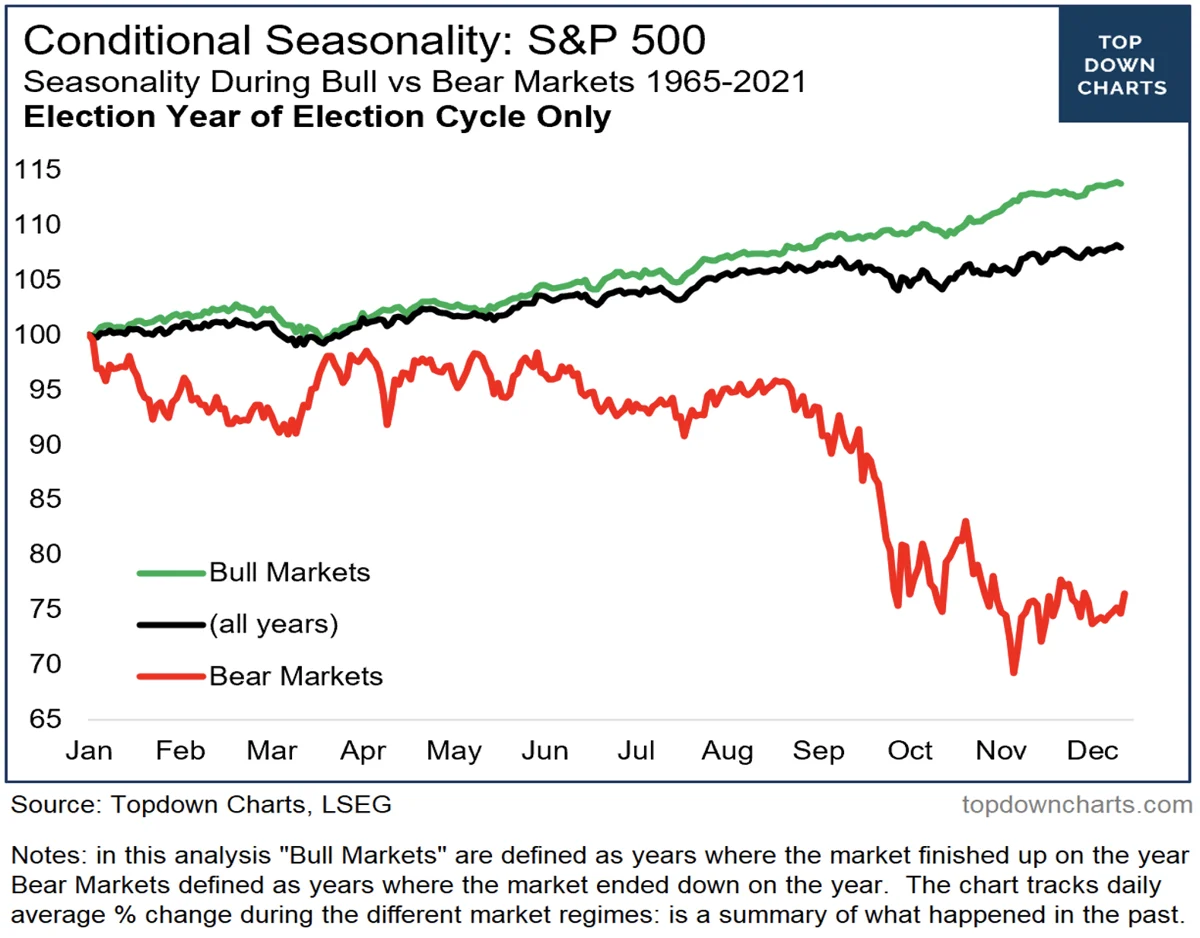
Turning to the near term, positive results in the first two months of the year have historically translated into gains for the full year as seen in the chart below. This particular chart narrows the study, focusing only on election years, and sees a wrinkle, i.e., while returns for the 12 months are positive overall, there can be some rough sledding for markets in the March-April time frame.
This tendency’s timing happens to coincide this year with the cessation of the Federal Reserve’s Bank Term Funding Program (albeit with a 12-month closing tail), a downshift in monies being invested in the Fed’s reverse repo program, and a possible buildup in the Treasury’s general account (TGA) due to tax receipts exceeding Treasury spending. All of these factors can serve to reduce liquidity and put pressure on asset prices.
fixed income
Fixed income markets, contrary to equities, fell in February with the broad Bloomberg U.S. Aggregate Bond Index dropping -1.41%. Interest-sensitive 10- and 30-year Treasuries saw deeper losses, with each dropping slightly more than -2% in the month. Corporate investment grade bonds declined 1.50% while mortgage backs dropped -1.63%. The only index to buck the negative trend was the Bloomberg U.S. Corporate High Yield Index, which posted a positive 0.29% return for the month.
The price action in February was indicative of a market that had rallied strongly into the end of January on hopes of continuing benign inflation numbers only to be surprised by relatively strong reported economic growth and slightly hotter than expected price inflation. As bond prices are determined by both duration and credit factors, it’s important to note the backup in February was mostly a matter of higher interest rates. Credit remained well bid,1as can be seen in the high yield OAS2, with spreads close to cycle lows. This would indicate any economic slowdown is of a temporary nature and brings into question whether a wholesale easing by the Fed is warranted.
Nonetheless, this is an election year and there is tremendous pressure on the Fed to act and bring down shorter-term rates if inflation remains relatively well-behaved in the next couple of months. If they do so it shouldn’t be surprising if the long end of the curve sells off (yields increase) as investors may start to worry about the Fed’s resolve in keeping inflation under control over the long run.
Federal Reserve and Monetary Policy
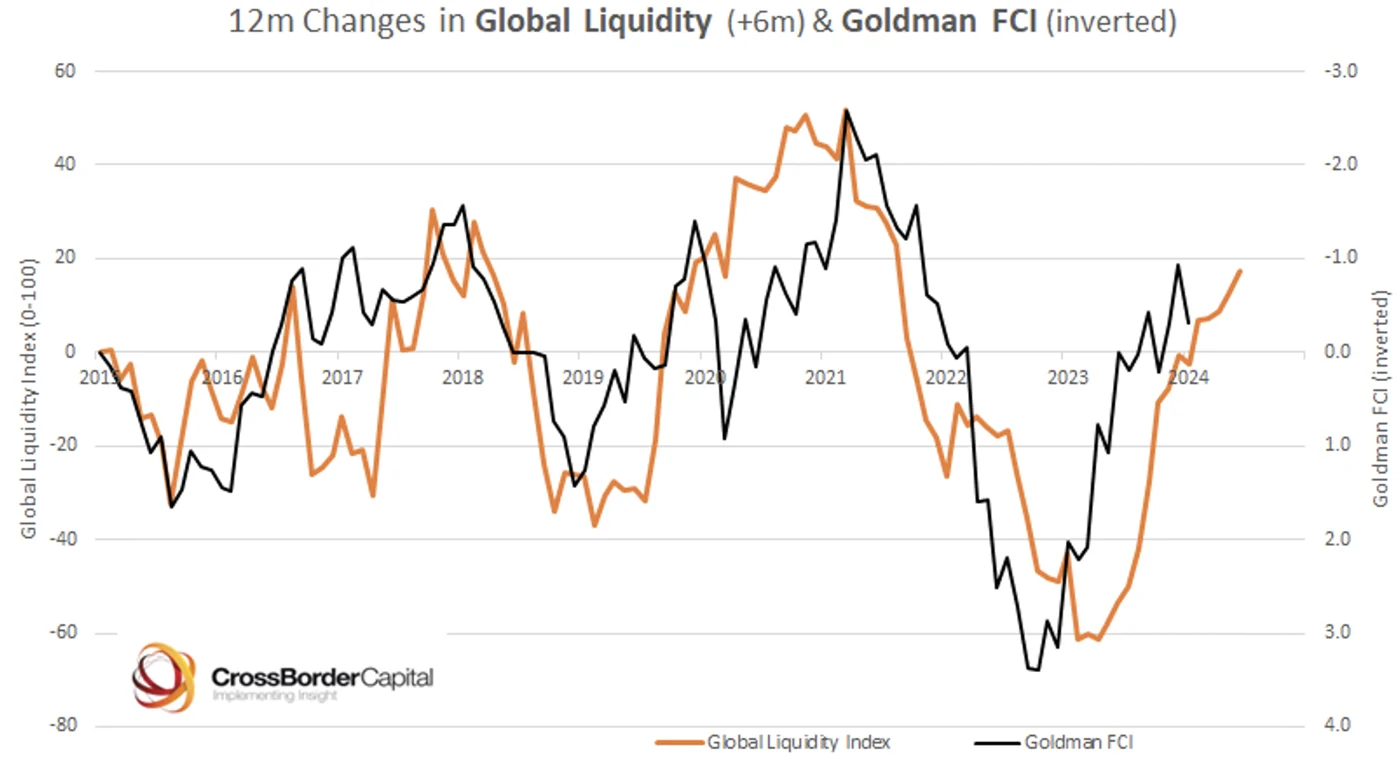
The market continues to expect the Federal Reserve to ease by mid-year, although odds have shrunk noticeably of late on the heels of better-than-expected economic reports. The case for easing is not clear-cut: fundamentally, the economy has been growing, even if at a more moderate pace, wage gains are healthy, unemployment claims remain low by historical standards, ISM Services PMI3 reading continue to signal expansion, and perhaps most important, fiscal stimulus is significant. Policy wise, financial conditions are and have been loose for many months, credit markets exhibit few signs of stress outside of commercial real estate, China’s central bank is easing, and global liquidity has been increasing ever since the gilt crisis in the fall of 2022 (chart below).
And while the front end of the yield curve reflects a tight monetary stance, longer duration Treasury yields remain inverted, suggestive of a monetary policy transmission yet to be felt in any major way by longer term borrowers (with the exception of homebuyers). This can change quickly, of course, but for the moment financial markets are more than coping with an ostensibly parsimonius central bank.
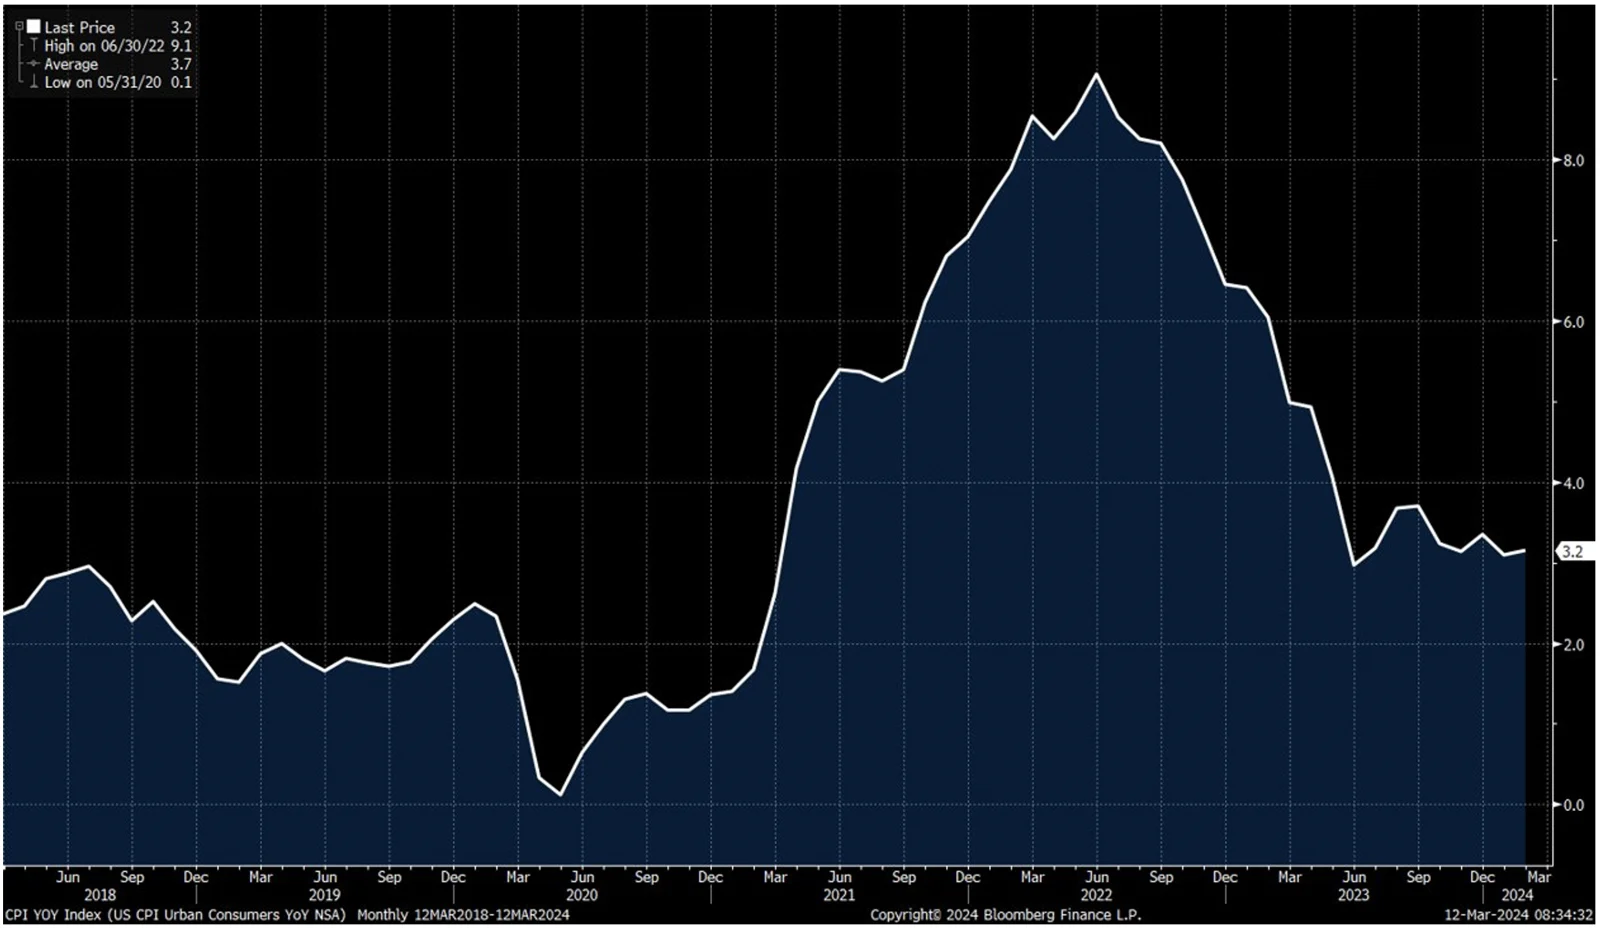
The counterargument for Fed easing rests in the main on the better inflation figures reported over the past several months. But to that point, and as seen in the chart below, inflation (as measured by the CPI year-over-year) while down substantially from the 2022 highs, has been flatlining since the middle of last year at a level far higher than the Fed’s 2% goal.
Managed Income Strategy
Manager Commentary: The Managed Income Strategy remains in a Risk-On position, fully allocated. The Strategy is allocated predominantly to U.S. High Yield, with a supplementary position allocated to senior loan/floating rate positions. The senior loan/floating rate space continues to outperform U.S. High Yield and virtually all other segments of the fixed income markets as rates continue to advance. We anticipate maintaining this allocation to supplement U.S. High Yield as the current Risk-On trade continues into its fifth month.
Dynamic Growth Strategy
Manager Commentary: Equity markets continued their upward march to new all-time highs during the month of February, as volatility remained relatively low. Despite some jitters during the middle of the month driven from a slightly higher-than-expected inflation print, the S&P 500 recorded its fourth straight month of positive returns, with all major segments of the market turning in positive returns.
As we move toward the end of the first quarter, we will be monitoring this development, as well as other economic data trends, including inflation and jobs numbers. The current stance remains Risk-On across the board, but an increase in volatility or reversal in the overall trend could result in the Dynamic Growth Strategy making its first Risk-Off pivot of the year. For now, however, conditions remain stable.
Active Advantage Strategy
Manager Commentary: During the month of February, the Active Advantage Strategy remained in a full Risk-On state, with a balanced position between fixed income and equities. As noted last month, the Strategy reduced the duration of its fixed income portion of the portfolio, which helped to mitigate downside risk as rates climbed. For February, the fixed income portion of the portfolio was relatively flat, while equities gained.
As we noted last month, we believe managing interest rate risk is still important, and any unexpected data, particularly with respect to employment and inflation figures, could cause sudden moves in duration-sensitive fixed income. Indeed, the January inflation data, reported in mid-February, came in higher than expected, and market participants have broadly readjusted their expectations for the number of interest rate cuts on the table for 2024. For this reason, Active Advantage remains overweight U.S. High Yield in its fixed income allocation.
Defender Strategy
Manager Commentary: In February, there was a steady rise in stock prices, predominantly led by mega-cap technology stocks, maintaining their position as the frontrunners in year-to-date performance. Notably, the indices continue to be influenced by a handful of companies, as evidenced by nearly 95% of the Nasdaq 100 market capitalization gains originating from just four entities: Nvidia, Meta, Microsoft, and Amazon. While the S&P 500 continues to benefit from the performance of large-cap tech stocks, signs of vulnerability are surfacing within the so-called “Magnificent 7,” with Apple and Google experiencing negative returns for the month. Furthermore, there are indications of market diversification, as Small-Cap and Mid-Cap stocks outperformed in February, alongside emerging strength in economically sensitive sectors such as consumer discretionary and industrial stocks.
In February, the Defender Strategy was allocated primarily to equity centric asset classes, taking advantage of their absolute and relative momentum strength. Entering March, we maintained allocations to U.S. Large-Cap Core Equities, U.S. Large-Cap Growth Equities, U.S. Small-Cap Equities, European Equities, Japanese Equities and U.S. High Yield Fixed Income.
Disclaimers:
Investing involves risk, including loss of principal. Past performance does not guarantee future results. There is no guarantee any investment strategy will generate a profit or prevent a loss.
This is for informational purposes only and is not a recommendation nor solicitation to buy, sell or invest in any investment product or strategy. Our materials may contain information deemed to be correct and appropriate at a given time but may not reflect our current views or opinions due to changing market conditions. No information provided should be viewed as or used as a substitute for individualized investment advice. An investor should consider the investment objectives, risks, charges, and expenses of the investment and the strategy carefully before investing.
Kensington Asset Management, LLC (“KAM”) relies on third party sources for some of its information that we believe is reliable. However, we make no representation, warranty, endorse or affirm as to its accuracy or completeness. The information provided is current as of the date of publication and may be subject to change. We are not responsible for updating this information to reflect any subsequent developments or events.
Any indices and other financial benchmarks shown are provided for illustrative purposes only, are unmanaged, reflect reinvestment of income and dividends and do not reflect the impact of advisory fees. Investors cannot invest directly in an index. Comparisons to indexes have limitations because indexes have volatility and other material characteristics that may differ from a particular strategy such as the types of securities being substantially different.
Certain information contained herein constitutes “forward-looking statements,” which can be identified using forward-looking terminology such as “may,” “will,” “should,” “expect,” “anticipate,” “project,” “estimate,” “intend,” “continue,” or “believe,” or the negatives thereof or other variations thereon or comparable terminology. Due to various risks and uncertainties, actual events, results, or actual performance may differ materially from those reflected or contemplated in such forward-looking statements. Nothing contained herein may be relied upon as a guarantee, promise, assurance, or a representation as to the future.
Advisory services offered through Kensington Asset Management, LLC, Barton Oaks Plaza, Bldg II, 901 S Mopac Expy – Ste 225, Austin, TX 78746.
Managed Income Strategy
Risks specific to the Managed Income Strategy include Management Risk, High-Yield Risk, Fixed-Income Security Risk, Foreign Investment Risk, Loans Risk, Market Risk, Underlying Funds Risk, Non-Diversification Risk, Turnover Risk, U.S. Government Securities Risk, LIBOR Risk, Models and Data Risk.
Dynamic Growth Strategy
Risks specific to the Dynamic Growth Strategy include Management Risk, Equity Securities Risk, Market Risk, Underlying Funds Risk, Non- Diversification Risk, Small and Mid-Capitalization Companies Risk, Turnover Risk, U.S. Government Securities Risk, Models and Data Risk.
Active Advantage Strategy
Risks specific to the Active Advantage Strategy include Management Risk, Equity Securities Risk, High-Yield Risk, Fixed-Income Security Risk, Foreign Investment Risk, Loans Risk, Market Risk, Underlying Funds Risk, Limited History of Operations Risk, Non-Diversification Risk, Small and Mid-Capitalization Companies Risk, Turnover Risk, U.S. Government Securities Risk, LIBOR Risk, Models and Data Risk.
Defender Strategy
Risks specific to the Defender Strategy are detailed in the prospectus and include general market risk, credit risk, interest rate risk, management risk, equity securities risk, fixed-income securities risk, high-yield bond risk, foreign investment risk, emerging markets risk, real estate and REITs risk, commodities risk, currency risk, subsidiary risk, market risk, underlying funds risk, derivatives risk, limited history of operations risk, turnover risk, models and data risk, momentum risk or risk of the portfolio not performing as expected.
Definition:
NASDAQ 100: A market index that comprises of the 100 largest, most actively traded companies listed on the Nasdaq stock exchange.
S&P 500: A capitalization weighted index of 500 stocks representing all major domestic industry groups. The S&P 500 TR Index assumes the reinvestment of dividends and capital gains.
Russell 2000 Index: A market index that consists of 2,000 small-cap US companies that are part of the larger Russell 3000 Index.
MSCI EAFE Index: An international equities market index that consists of large and mid-cap stocks across developed markets in Europe, Australasia, and Far East Asia. Excludes US and Canadian stocks.
Bloomberg US Aggregate Bond Index: An unmanaged index comprised of US Investment grade fixed rate bond market securities, including government agency, corporate and mortgage-backed securities. Investors cannot invest directly in an index. It is also known as US Aggregate Bond Index.
Bloomberg US Corporate High Yield Index: An unmanaged market value-weighted index that covers the universe of fixed-rate, non-investment grade debt in the US. Securities are classified as high yield if the middle rating of Moody’s, Fitch and S&P is Ba1/BB+/BB+ or below. Bonds from issuers with an emerging markets country of risk, based on the indices’ EM country definition, are excluded.
Global Liquidity Index: A consolidated view of major central bank balance sheets from around the world in USD.
Goldman Sachs Financial Conditions Index (FCI): A tool used to assess the overall health of financial markets and their impact on the broader economy. Weighted average of several variables, including Riskless Interest Rates, Exchange Rate, Equity Valuations, and Credit Spreads. Weights to each variable correspond to their direct impact on GDP.
Related Perspectives
View All-
Strategy Review – June 2026
March was shaped by a sharp escalation in US-Iran tensions, a surge in energy prices, and renewed concern that inflation could stay stickier than expected. The Federal Reserve again held rates steady, while higher oil prices and rising yields pressured traditional risk assets.
-
Monthly Market Commentary – June 2026
June’s central tension was that positive US economic data coincided with weakness in certain large-cap equities.
