Inflation’s Stubborn Pace
Market Insights
By Kensington Asset Management Team
Market Insights is a weekly piece in which Kensington’s Portfolio Management team will share interesting and thought-provoking charts that we believe provide insight into markets and the current investment landscape.
CPI: A Bump in the Disinflationary Road
Expected Federal Funds Rate*
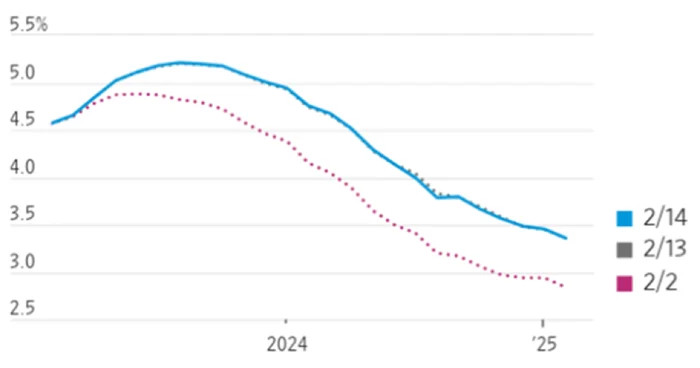
This week’s release of January inflation data represented a slight decline from December, but a higher reading than analysts’ expectations. Energy, housing, and food contributed to an overall print of 6.4%, compared to the projected figure of 6.2%. While current inflation readings are a far cry from June’s 9.1% print, the pace of cooling is not moving as fast as some market participants had hoped. This is reflected in current activity by rates traders with the implied federal funds rate moving markedly higher over the past two weeks. Markets are now pricing in two more rate hikes in 2023 (March/May) of 25bps and a Fed funds rate of 5.00-5.25%, peaking in July, with only one rate cut priced in late 2023, falling in line with Fed Chairman Powell’s “higher for longer” mantra.
Gimme Shelter
Monthly Change in U.S. Shelter Price Index

Much of the gain in CPI was attributable to shelter/housing, which was up 0.7% in January. It didn’t help that the percentage contribution to the CPI formula for housing was adjusted up this month to 44.4% from 42.4% previously.
“The index for shelter was by far the largest contributor to the monthly all items increase, accounting for nearly half of the monthly all items increase,” the U.S. Bureau of Labor Statistics said at the top of its press release. The shelter/housing dominance offered investors some comfort, given that pricing there tends to react slower than other parts of the economy — meaning existing rate hikes could still be due to take effect.
Core Goods on the Rise?
Core Goods
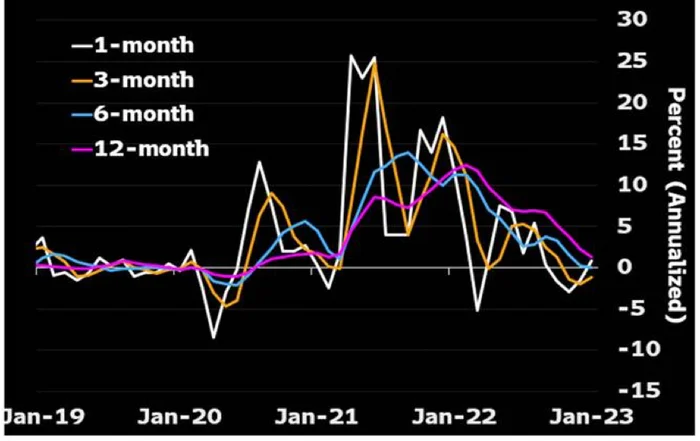
According to the Fed, Core Goods are in a disinflationary trend, which is true when measured on a trailing 12-month calculation (pink), the measure often cited by the press, but the year-over-year decline may be misleading. This measure can sometimes tell you more about high inflation months from a year ago dropping out of the twelve-month window than it does about its current trajectory.
Focusing on the 1-month change in core goods prices (white) is more concerning as the measure moved up in January, after falling in the previous two months. While it wasn’t a big increase, this is an area where continued disinflation will be necessary if the Fed is to reach their 2% target anytime soon. If the positive month-over-month trajectory continues we may see Chairman Powell’s mantra of “higher for longer” turn into “much higher for much longer”.
Disclaimers:
Forward-looking statements are based on management’s then current views and assumptions and, as a result, are subject to certain risks and uncertainties that could cause actual results to differ materially from those projected. This market insight is for informational purposes only and should not be construed as a solicitation to buy or sell, or to invest in any investment product or strategy. Investing involves risk including loss of principal.
Related Perspectives
View All-
KHPI’s Fiscal Year 2025 Review and the Power of Net-of-Tax Performance
KHPI’s Fiscal Year 2025 Review and the Power of Net-of-Tax Performance Monthly Market Commentary By Kensington Asset Management Team The following is for informational purposes only and not construed as tax advice. Please consult with a tax professional for your specific situation. For the modern fiduciary, performance is a multi-dimensional metric. While investment returns capture […]
-
KENSINGTON SPOTLIGHT SERIES: THE DEFENDER STRATEGY
At Kensington Asset Management, we’ve actively managed fixed income solutions for clients for over three decades. Throughout this journey, we’ve weathered all types of macroeconomic regimes from extreme market volatility events to periods of steady growth.
