Kensington Monthly Commentary – July 2025
Monthly Market Commentary
By Kensington Asset Management Team
The second half of 2025 began with broad gains in risk assets, though leadership remained narrow and underlying breadth mixed. Equity indices advanced in July, credit held firm, and the Federal Reserve stayed in a holding pattern while incoming data increasingly pointed to cooling growth and easing inflation pressure. We review markets below and outline our current policy and risk views.
Stock Market
Major equity indices continued higher in July: the S&P 500 Index rose 2.17%, the Nasdaq 100 gained 2.38%, and the Russell 2000 added 1.68%. Overseas markets also improved, with MSCI EAFE Index up 1.38% and MSCI Emerging Markets Index up a robust 3.37%. Seasonally, July has historically been one of the market’s better months, and this year fits that pattern.
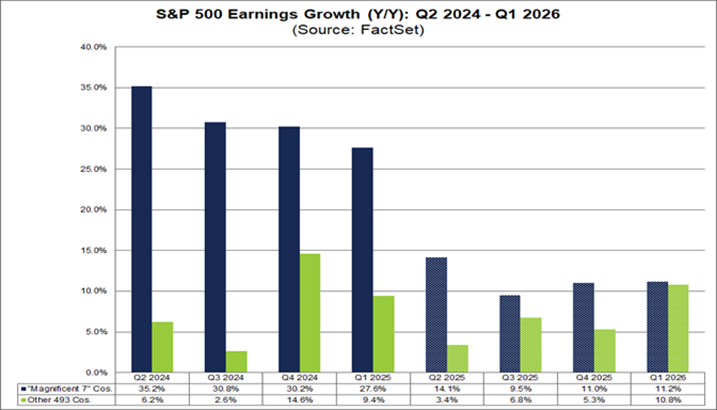
Headline strength masked softer breadth. The S&P 500 Equal Weight Index advanced only 0.88%, in July. The earnings backdrop helps explain the split. Mega-cap technology leaders continued to deliver strong results while the broader cohort slowed, with consensus earnings growth for the largest constituents outpacing the remaining 493 companies.
Earnings season, in aggregate, looked better than feared. More than 80% of companies have reported results above consensus so far, but it is important to note that estimates were reduced more than average heading into the quarter. Companies posting negative EPS surprises were punished more than usual, with an average one-day price decline of roughly 5.6% compared with a 5-year average decline of about 2.4%.
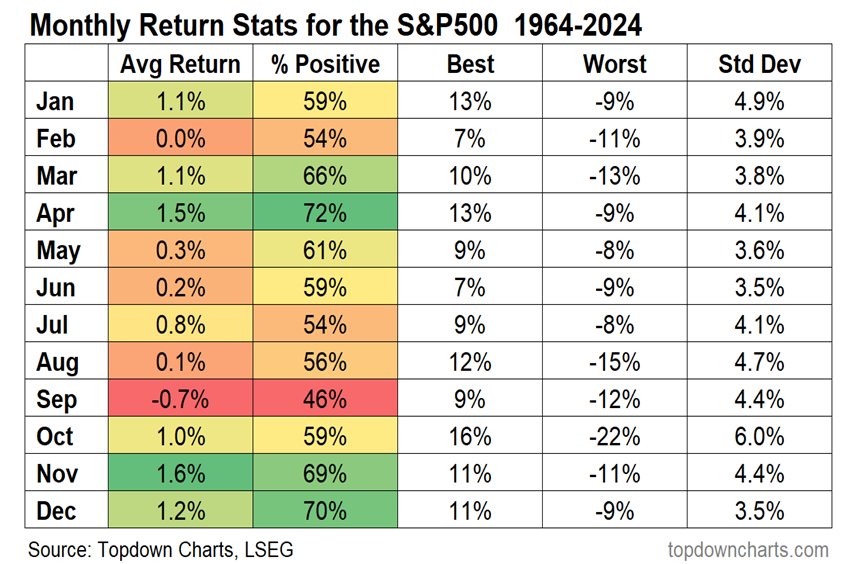
Looking ahead to August and September, history shows late summer is typically a flatter return period with the VIX (CBOE Volatility Index) often troughing in August. Thus far, realized and implied volatility have been stickier than that seasonal pattern would suggest. One reason is persistent retail participation. As highlighted by recent flow data, retail investors were net buyers in 15 of the last 17 weeks through mid-August and have been net additive for 19 consecutive months on a notional basis. Combine that steady demand with elevated corporate buyback authorizations and a gradual rebuilding of institutional equity exposure, and the path of least resistance for prices has remained higher. Near term, however, September bears watching given its weak seasonality and the fact that systematic strategies like Commodity Trading Advisors (CTAs), vol-control, and risk-parity have re-levered back toward historical allocations.

Fixed Income
Bond returns were generally flat to modestly lower in July, with the notable exception of high yield. The 10-year Treasury posted a -0.67% total return for the month, the Bloomberg US Corporate Investment Grade Index edged up 0.07%, and the Bloomberg US Mortgage-Backed Securities (MBS) Index declined -0.41%. At the long end, the 30-year Treasury fell -1.25%. High yield outperformed, with the Bloomberg US Corporate High Yield Index up 0.45% amid supportive equity markets and stable spreads.
Year to date, dispersion along the curve is pronounced. The 30-year Treasury is up only 0.83% YTD, compared with a 4.31% gain for the 10-year Treasury, a 4.24% increase for the Bloomberg US Investment Grade Corporates Index, and a 3.81% gain for the Bloomberg US MBS Index. We view the long-end underperformance as a reflection of rising term premia tied to fiscal, geopolitical, and, for foreign holders, currency risks. Auction dynamics and net supply are likely to remain important drivers of duration performance in the months ahead.
Federal Reserve and Monetary Policy
The Fed left policy unchanged in July and continued to emphasize data dependence. That stance was quickly tested by the August employment report, which came in below expectations and included meaningful downward revisions to prior months. Market-implied policy expectations adjusted swiftly, with the 2-year Treasury yield dropping by nearly 30 basis points and Fed funds futures increasing the probability of a September rate cut.
We believe the Committee is leaning toward an initial 25 basis point reduction in September. The rationale rests on three pillars: 1) accumulating evidence of a growth slowdown, 2) heightened political and internal policy pressure to normalize rates as risks balance, and 3) inflation measures that, while still above the long-run 2% objective, continue to trend lower and appear less entrenched. A quarter-point move by itself will not materially stimulate activity or risk a reacceleration of inflation, but it would carry signaling value. If Chair Powell pairs a cut with guidance that the policy stance is shifting toward a lower-rate regime, financial conditions could ease as investors discount a more accommodative 2026 path.
Disclosures:
Investing involves risk, including loss of principal. Past performance does not guarantee future results. There is no guarantee any investment strategy will generate a profit or prevent a loss.
This is for informational purposes only and is not a recommendation nor solicitation to buy, sell or invest in any investment product or strategy. Our materials may contain information deemed to be correct and appropriate at a given time but may not reflect our current views or opinions due to changing market conditions. No information provided should be viewed as or used as a substitute for individualized investment advice. An investor should consider the investment objectives, risks, charges, and expenses of the investment and the strategy carefully before investing.
Kensington Asset Management, LLC (“KAM”) relies on third party sources for some of its information that we believe is reliable. However, we make no representation, warranty, endorse or affirm as to its accuracy or completeness. The information provided is current as of the date of publication and may be subject to change. We are not responsible for updating this information to reflect any subsequent developments or events.
Any indices and other financial benchmarks shown are provided for illustrative purposes only, are unmanaged, reflect reinvestment of income and dividends and do not reflect the impact of advisory fees. Investors cannot invest directly in an index. Comparisons to indexes have limitations because indexes have volatility and other material characteristics that may differ from a particular strategy such as the types of securities being substantially different.
Certain information contained herein constitutes “forward-looking statements,” which can be identified using forward-looking terminology such as “may,” “will,” “should,” “expect,” “anticipate,” “project,” “estimate,” “intend,” “continue,” or “believe,” or the negatives thereof or other variations thereon or comparable terminology. Due to various risks and uncertainties, actual events, results, or actual performance may differ materially from those reflected or contemplated in such forward-looking statements. Nothing contained herein may be relied upon as a guarantee, promise, assurance, or a representation as to the future.
Advisory services offered through Kensington Asset Management, LLC, Barton Oaks Plaza, Bldg II, 901 S Mopac Expy – Ste 225, Austin, TX 78746.
Definitions:
Bloomberg US Corporate High Yield Index: An unmanaged market value-weighted index that covers the universe of fixed-rate, non-investment grade debt in the US. Securities are classified as high yield if the middle rating of Moody’s, Fitch and S&P is Ba1/BB+/BB+ or below. Bonds from issuers with an emerging markets country of risk, based on the indices’ EM country definition, are excluded.
Bloomberg US Mortgage-Backed Securities (MBS) Index: An unmanaged index that tracks fixed-rate agency mortgage-backed pass-through securities guaranteed by Ginnie Mae (GNMA), Fannie Mae
CBOE Volatility Index (VIX): Often called the “fear index,” measures the market’s expectations for volatility over the next 30 days based on S&P 500 index options. It is a key indicator of market sentiment, with higher values indicating greater expected volatility.
MSCI EAFE Index: An international equities market index that consists of large and mid-cap stocks across developed markets in Europe, Australasia, and Far East Asia. Excludes US and Canadian equities.
MSCI Emerging Markets Index: An international equities market index that consists of large and mid-cap stocks across 24 emerging market countries that include but not limited to Brazil, Chile, China, Colombia, Czech Republic, Egypt, Greece, Hungary, India, Indonesia, South Korea, Kuwait, Malaysia, Mexico, Peru, Philippines, Poland, Qatar, Saudi Arabia, South Africa, Taiwan, Thailand, Turkey, and United Arab Emirates.
NASDAQ 100 Index: A market index that comprises of the 100 largest, most actively traded companies listed on the Nasdaq stock exchange.
Russell 2000 Index: A market index that consists of 2,000 small-cap US companies that are part of the larger Russell 3000 Index.
S&P 500: A capitalization weighted index of 500 stocks representing all major domestic industry groups. The S&P 500 TR Index assumes the reinvestment of dividends and capital gains.
S&P 500 Equal Weight Index: Equal weight to each of the 500 companies in the S&P 500, ensuring that each company has the same impact on the index’s performance, regardless of its market capitalization
KAM20250814
Related Perspectives
View All-
Kensington Monthly Commentary – November 2025
The stock market endured one of its most volatile months in years. The S&P 500 fell 21.35% from its February 19 peak of 6,147.43 before bottoming on April 7 at 4,835.04, shortly before the Administration announced a 90-day pause on new tariffs (excluding China). Markets quickly rebounded on the news, with the S&P 500 soaring 9.52% on April 9, its largest single-day gain since October 2008. The Nasdaq Composite jumped 12.16% the same day, marking its biggest one-day percentage gain since January 3, 2001, and the second-largest on record.
-
Strategy Review – November 2025
Risk assets delivered mixed but generally positive results in November as investors weighed softer labor data, the ongoing government shutdown, and the prospect of another Federal Reserve rate cut in December.