Market Concentration’s Double-Edged Sword
Market Insights
Brian Weisenberger, CFA, Senior Market Strategist
Market Insights is a piece in which Kensington’s Portfolio Management team will share interesting and thought-provoking charts that we believe provide insight into markets and the current investment landscape.
Concentration Cuts Both Ways
For the past 18 months, the U.S. stock market has been defined by increasing concentration to a very small number of mostly technology related companies, fueled by the “AI trade” pushing the S&P 500 to hit 38 new all-time highs through July. But concentration can cut both ways. In our February 2024 Market Insights piece we noted that, “concentrated influence by a few stocks can be beneficial for equity markets in the short term…”, but “…extremely concentrated markets present a clear and present risk to equity markets in 2024”. When a small number of companies are responsible for such a relatively large percentage of an index, any weakness from those companies can shift the “market” negatively quickly.
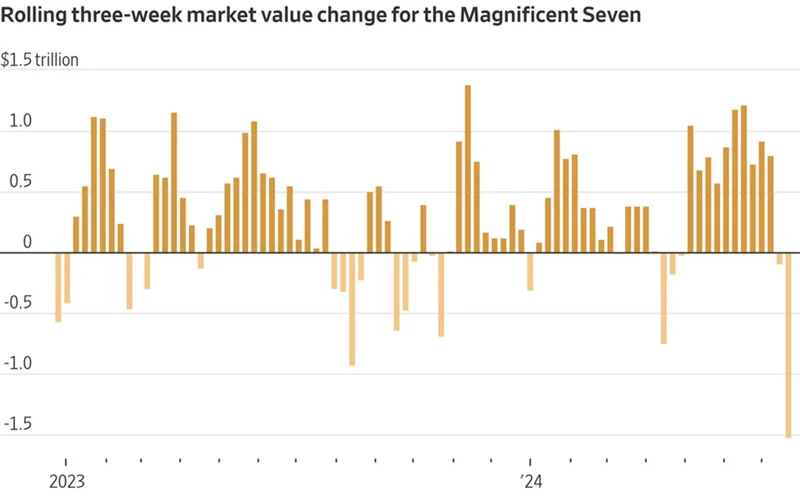
That’s exactly what we’ve seen over the past several weeks. The Magnificent Seven group of tech titans have shed, through July 30th, $1.52 trillion in market value in the past three weeks, the largest drop over a three-week period on record (chart below).
Mag 7 Role Reversal
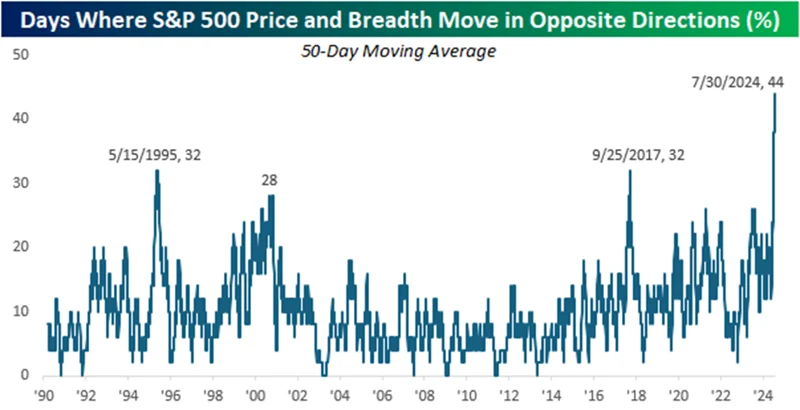
Recent market action is almost an exact inverse of what we’ve seen for the last year and a half, where most stocks struggled to tread water while the Magnificent 7 soared, bringing cap weighted indices along for the ride. Last week (week ending July 26th) saw 437 stocks (~87%) in the S&P 500 close higher, yet the index was down almost 1%. Since 1990, price and breadth of the S&P 500 have never diverged as frequently as they have over the last 50 trading days (chart below).
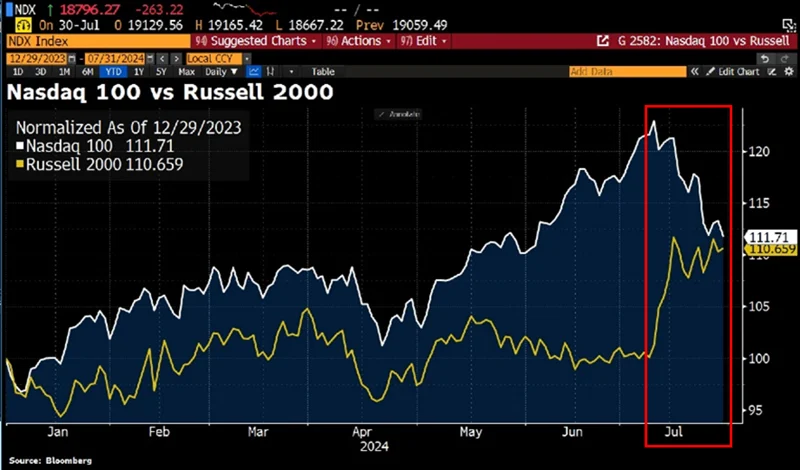
Thankfully, recent market action has not been a complete market pullback so much as it has been a market rotation, with U.S. Small Caps benefitting the most. The Russell 2000 – which trailed the Nasdaq 100 by 21% YTD just two weeks ago – pulled almost even through July 30, as the Russell 2000 rallied over 10% from July 9th to July 26th, while the Nasdaq 100 fell 8% during the same period (chart below).
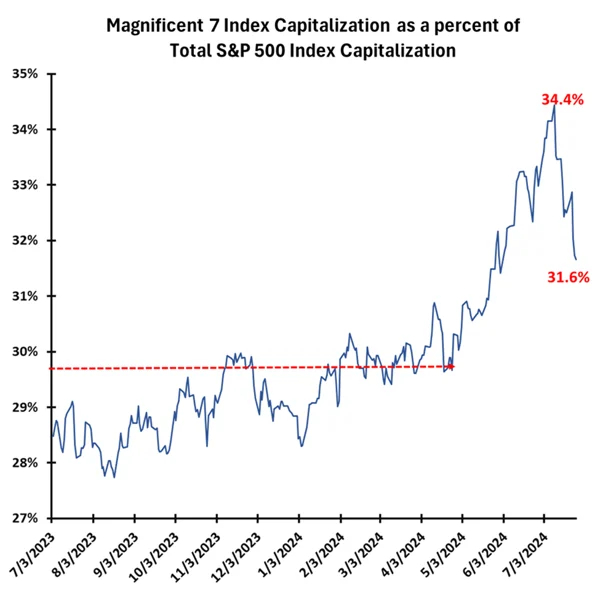
This rapid shift has been remarkable and detrimental to large cap index investors, but one natural byproduct of recent struggles by tech giants is improved overall market health. In the 12 trading days post the July 10th peak in the Magnificent 7 stock price index, its market cap relative to the S&P 500 total market cap has reduced by approximiately 2.8% (chart below). While still a far cry from the long-term historical average, which has generally ranged between 15% and 25% for the top 10 stocks over the past 35 years, further broadening would lessen prevailing concentration risk for the index.
Where do we go from here?
The last month has shown us how quickly market dynamics can change. To assess what the remainder of the year will bring, there are several factors worth noting. One of the largest drivers of the Magnificant 7’s runup over the last 18 months has been their explosive earnings growth, which averaged almost 25% in 2023 and an impressive 51.2% in Q1 2024 (chart below). But as we noted in our last Market Insights, this growth is expected to decelerate in the coming quarters, while the “Other 493” in the S&P 500 are expected to see their earnings grow, perhaps suggesting that the recent rotation to smaller capitalization stocks will continue.

S&P 500 Turnaround?
While smaller capitalization stocks may in fact take the reigns through the remainder of this year, it doesn’t necessarily mean cap-weighted indices have to suffer. While the correlation between the cap-weighted S&P 500 index and the equal-weighted S&P 500 index have recently fallen to their lowest level since the launch of the equal-weighted index in 2003 (chart below), they have averaged a correlation greater than 0.97 over the past 20 years. Despite recent history, typically stocks within the index move together.

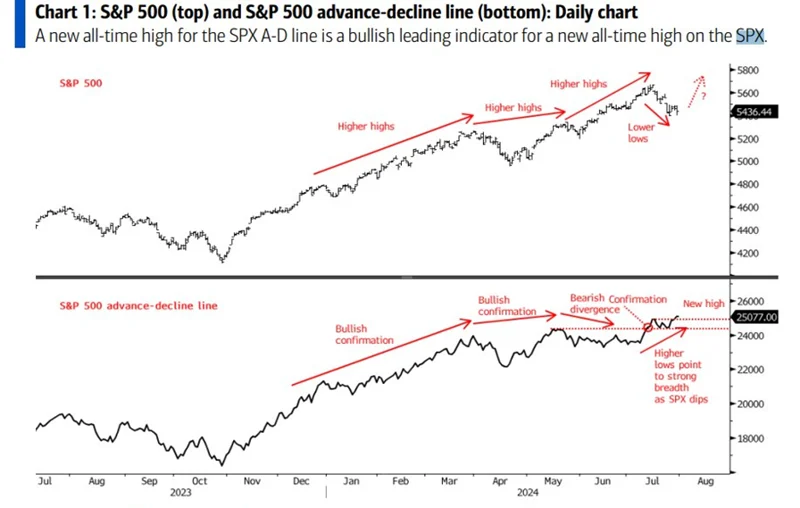
Further, the recent expansion in breadth within the S&P 500 may also be a positive sign of things to come for the index, at least in the short term. As Doug Ramsey at the Leuthold Group noted in his July 30th MTI (Major Trend Index) report, “If viewed in isolation, the stock market’s recent broadening portends new highs in the coming months. The S&P 500’s July 16th high was accompanied by a new cycle peak in the Daily NYSE Advance/Decline Line. In the last 70 years, there have only been two bull market peaks that were not preceded by at least a brief period of divergently weak action in the A/D Line.”
Stephen Suttmeier of BofA similarly points out, “A new all-time high on the S&P 500 advance-decline line (chart below), has historically been a bullish leading indicator for a new all-time high on the S&P 500.” Additionally, August in Presidential election years have been historically strong, with the S&P 500 up 71% of the time, registering an average return of 3.1%.
Recent market developments underscore the inherent volatility and the dynamic nature of market concentration. While the dominance of a few tech giants has significantly influenced market trends over the past 18 months, the recent shift towards broader market participation and the resurgence of smaller-cap stocks may signal a healthier overall market structure. This rotation could potentially mitigate the risks associated with high concentration, fostering a more balanced and sustainable growth trajectory, particularly for well-rounded portfolios.
As we move forward, staying attuned to earnings performance and market breadth will be crucial in navigating the evolving landscape and making informed investment decisions. The road ahead may be uncertain, but the diversification and increased participation across various market segments provide a promising outlook for investors.
Disclaimers:
Investing involves risk, including loss of principal. Past performance does not guarantee future results. There is no guarantee any investment strategy will generate a profit or prevent a loss.
This is for informational purposes only and is not a recommendation nor solicitation to buy, sell or invest in any investment product or strategy. Our materials may contain information deemed to be correct and appropriate at a given time but may not reflect our current views or opinions due to changing market conditions. No information provided should be viewed as or used as a substitute for individualized investment advice. An investor should consider the investment objectives, risks, charges, and expenses of the investment and the strategy carefully before investing.
Kensington Asset Management, LLC (“KAM”) relies on third party sources for some of its information that we believe is reliable. However, we make no representation, warranty, endorse or affirm as to its accuracy or completeness. The information provided is current as of the date of publication and may be subject to change. We are not responsible for updating this information to reflect any subsequent developments or events.
Certain information contained herein constitutes “forward-looking statements,” which can be identified using forward-looking terminology such as “may,” “will,” “should,” “expect,” “anticipate,” “project,” “estimate,” “intend,” “continue,” or “believe,” or the negatives thereof or other variations thereon or comparable terminology. Due to various risks and uncertainties, actual events, results, or actual performance may differ materially from those reflected or contemplated in such forward-looking statements. Nothing contained herein may be relied upon as a guarantee, promise, assurance, or a representation as to the future.
Advisory services offered through Kensington Asset Management, LLC, Barton Oaks Plaza, Bldg II, 901 S Mopac Expy – Ste 225, Austin, TX 78746.
Related Perspectives
View All-
KHPI’s Fiscal Year 2025 Review and the Power of Net-of-Tax Performance
KHPI’s Fiscal Year 2025 Review and the Power of Net-of-Tax Performance Monthly Market Commentary By Kensington Asset Management Team The following is for informational purposes only and not construed as tax advice. Please consult with a tax professional for your specific situation. For the modern fiduciary, performance is a multi-dimensional metric. While investment returns capture […]
-
KENSINGTON SPOTLIGHT SERIES: THE DEFENDER STRATEGY
At Kensington Asset Management, we’ve actively managed fixed income solutions for clients for over three decades. Throughout this journey, we’ve weathered all types of macroeconomic regimes from extreme market volatility events to periods of steady growth.
