Measuring Volatility And Market Risk
Market Insights
By Kensington Asset Management Team
Market Insights is a weekly piece in which Kensington’s Portfolio Management team will share interesting and thought-provoking charts that we believe provide insight into markets and the current investment landscape.
February has proven to be an extremely volatile period for equity markets. From February 1st through last Friday, February 17th, there were a total of 13 NYSE trading days. During this period, the S&P 500 (SPX) saw a staggering amount of intra-day volatility, with 18 different occasions where the index experienced a reversal of at least 1%. Of those, five reversals saw the SPX move at least 2%. Despite all these fluctuations, the S&P 500 ultimately ended the period essentially unchanged, with a decline of only -0.84%.

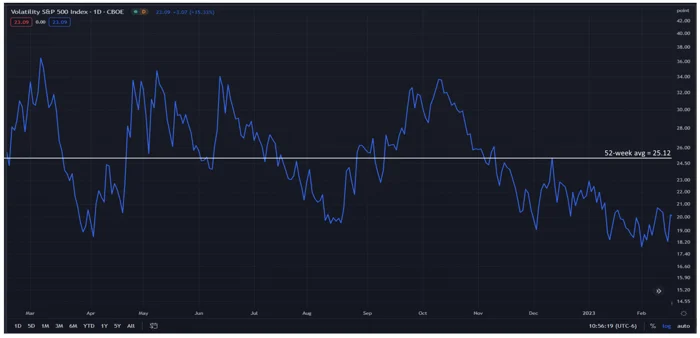
Interestingly, the VIX (often referred to as the “Fear Index”), an index commonly regarded as a proxy to gauge market volatility, remained subdued during this period, with an average closing value during this period of 19.35, which is well below its 52-week average close of 25.12. It even reached its one-year low on February 2nd at 17.06.
There may be various explanations for the disparity between the subdued VIX levels and the experiences of investors, at least on a day-to-day basis. For one, the VIX calculations employ S&P 500 option contracts with more than 23 days and less than 37 days remaining until maturity. It does not measure actual market volatility but rather investors’ expectations for volatility, and only for that 23- to 37-day window.
In recent months, there has also been a significant increase in the use of zero days to expiration (0DTE) options, perhaps at the expense of VIX options. These are contracts that have less than one day to expiration or, in other words, same-day expiration. According to JP Morgan data, the daily notional value for these contracts has risen to about $1 trillion. This accounts for roughly 44% of the 10-day average daily volume for S&P 500 Index options, up from 19% a year ago. The VIX may not be reflecting volatility because it is not how investors are electing to reflect their views in the options market.
Much has been written about the potential risks associated with the rise of 0DTE usage, (here, and here as examples), but their usage is unlikely to diminish. For investors and advisors, it is vital to recognize that there are various ways to measure volatility and risk in the market, and it is crucial to utilize investments that strive to navigate volatile markets, regardless of how they are being measured.
Disclaimers:
Forward-looking statements are based on management’s then current views and assumptions and, as a result, are subject to certain risks and uncertainties that could cause actual results to differ materially from those projected. This market insight is for informational purposes only and should not be construed as a solicitation to buy or sell, or to invest in any investment product or strategy. Investing involves risk including loss of principal.
Related Perspectives
View All-
KHPI’s Fiscal Year 2025 Review and the Power of Net-of-Tax Performance
KHPI’s Fiscal Year 2025 Review and the Power of Net-of-Tax Performance Monthly Market Commentary By Kensington Asset Management Team The following is for informational purposes only and not construed as tax advice. Please consult with a tax professional for your specific situation. For the modern fiduciary, performance is a multi-dimensional metric. While investment returns capture […]
-
KENSINGTON SPOTLIGHT SERIES: THE DEFENDER STRATEGY
At Kensington Asset Management, we’ve actively managed fixed income solutions for clients for over three decades. Throughout this journey, we’ve weathered all types of macroeconomic regimes from extreme market volatility events to periods of steady growth.
