Monthly Market Commentary – January 2026
(As of 01/31/2026)
Monthly Strategy Commentary
By Kensington Asset Management Team
Stock Market
Equity markets advanced in January, a start that has often coincided with positive full-year outcomes. The S&P 500 gained 1.37%, while the equal-weight version rose 3.28% and the Nasdaq 100 added 1.20%. Small caps led, with the Russell 2000 up 5.31%. International equities also participated, as MSCI EAFE rose 3.22% and MSCI Emerging Markets increased 8.78%.
Since 1940, when the S&P 500 has finished January higher, the market has ended the year up about 89% of the time, with an average full-year return near 17%. What makes the current period notable is that 2023 through 2025 each delivered double-digit gains. That three-year run has only occurred six times historically, and in four of those six cases, year four was also positive.
| Period | Number of Years | Notable Context |
| 1949–1952 | 4 Years | Post-war economic expansion. |
| 1958–1961 | 4 Years | Late 50s bull market. |
| 1982–1985 | 4 Years | Early Reagan era; recovery from 70s stagflation. |
| 1988–1991 | 4 Years | Recovery from the ’87 crash through the Gulf War. |
| 1995–1999 | 5 Years | The Dot-com mania. |
| 2003–2006 | 4 Years | Housing-led expansion. |
| 2023–2026? | Ongoing | Currently at 3 years; 2026 would make 4. |
One of the historical examples extended further, with markets posting five consecutive positive years. Those episodes are also useful because they share key characteristics with the current AI-led cycle. The 1920s, 1990s, and 2020s were each shaped by three overlapping dynamics: a broad-based technology shift, an elevated level of index concentration, and a change in how households engage with markets.
1) A broad-based technology shift
- 1920s: electrification and radio boosted productivity and created mass-media advertising.
- 1990s: the internet reshaped communication and commerce.
- 2020s: artificial intelligence is increasingly viewed as a foundational platform, and 2023 to 2025 featured a capex surge that resembles prior buildout cycles.
Each cycle was linked to a general purpose innovation, one that changes business behavior across industries rather than driving a single product.
2) Market concentration: In all three eras, headline index performance was disproportionately driven by a narrow set of leaders.
| Era | The “Leaders” | Concentration Level |
| 1920s | RCA, General Motors, General Electric | Top 10 stocks composed roughly 35% of the market. |
| 1990s | Cisco, Microsoft, Intel, Dell | A small set of Tech leaders led markets. |
| 2020s | Nvidia, Microsoft, Apple, Alphabet | The “Magnificent Seven” reached a record ~35% share of the S&P 500 in 2024–2025. |
3) Valuation: The Shiller CAPE ratio1 illustrates how technology-led cycles can coincide with extended valuation regimes.
- 1929 peak: approximately 32.6
- 2000 peak: approximately 44.2
- current: roughly 40
The implication is not that outcomes must be the same, but that the combination of strong narratives, heavy investment, and concentrated leadership can extend cycles longer than expected, while also making markets more sensitive to shifts in liquidity and expectations.
Fixed Income
Bond performance was mixed in January. Longer-term Treasuries declined modestly, while credit-sensitive sectors were stronger. The Bloomberg US Investment Grade Index rose 0.18% and the US Corporate High Yield Index gained 0.51%. (The 10-year and 30-year Treasury returns were each down a little more than 40 basis points.)
The debt market also offers historical parallels during major buildout cycles.
| Era | Primary Source of Capital | Leverage Risk |
| 1870s (Railroads) | Govt Bonds & Land Grants | High (Dependence on land sales) |
| 1920s (Electrification) | Real Estate Bonds | Moderate (Consumer credit expansion) |
| 1990s (Dot-Com) | IPO Equity / Vendor Debt | High (many companies were unprofitable) |
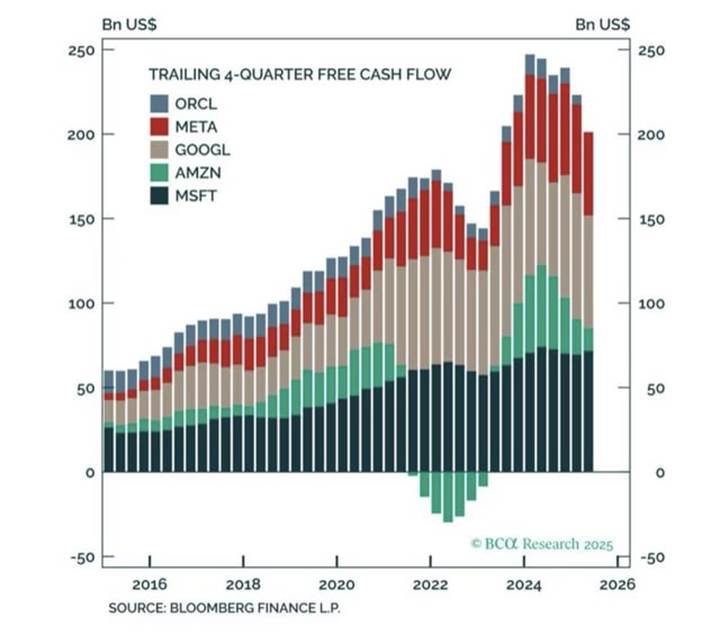
| 2026 (AI Buildout) | Operating Cash Flow + Mega Bonds | Low-to-Moderate (Highly profitable, but Free Cash Flow is drying up) |
The current AI buildout has clear infrastructure features, with high-end GPUs and data centers functioning as the backbone. The key difference is the funding mix. Many of today’s hyperscalers are highly profitable and initially funded investments through internal cash flow, but the scale of spending increasingly pressures free cash flow and encourages greater reliance on debt markets.
Across cycles, the pattern is familiar: credit conditions stay benign as enthusiasm builds, spreads tighten, and risk tolerance rises. Later, when funding becomes more constrained or fundamentals weaken, credit often signals stress before equities do.
By early 2026, estimated AI capex for the top US hyperscalers is roughly $650 to $700 billion. In recent quarters, free cash flow has fallen sharply for some firms as investment accelerates. In our view, a modern analogue to vendor financing is emerging, as hyperscalers provide liquidity and compute credits that effectively recycle capital back into their own tech ecosystems.
What could be the early warning signal in this cycle? A realistic possibility is not an immediate collapse in growth, but an environment where strong growth and sustained fiscal spending pull liquidity into the real economy. Historically, that can be less supportive for financial assets when it coincides with larger deficits and higher long-term yields (including a higher term premium).
Federal Reserve and Monetary Policy
Outside of headlines around Fed leadership, the monetary-policy backdrop has been relatively straightforward. Data continue to support an economy growing at a solid pace, even as labor demand cools at the margin. Core PCE, the Fed’s preferred inflation measure, has held near recent levels, giving the FOMC flexibility to remain patient. Market pricing currently suggests the Fed may not begin easing until summer.
Housing inflation remains central to the timing, particularly Owner’s Equivalent Rent (OER). OER estimates the rent a homeowner would pay to rent their own home (or could earn by renting it out). While it is not a direct measure of market rents, it carries meaningful weight in inflation indices.
Because market rents typically lead OER by 6 to 12 months, the slowdown in rent growth suggests OER should continue to decelerate. Zillow’s CPI Shelter Forecast, which uses its Observed Rent Index (ZORI) and applies a lag structure designed to approximate how rent changes filter into OER, continues to point to a cooling trend in shelter inflation in the months ahead.
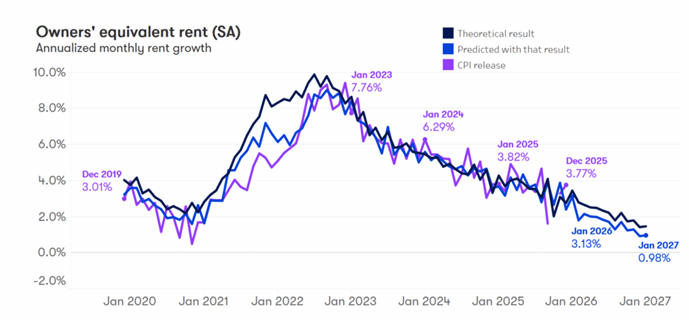
Source: Zillow as of January 2026
If that path is broadly correct, the disinflation impulse from housing could be potentially stronger than the market expects. By year-end 2026, core PCE could plausibly drift toward 2.0% to 2.1%. Offsetting forces may include firmer goods prices (including tariff-related impacts) and services inflation, particularly health care. Even with those offsets, the trajectory implies the Fed’s inflation objective is within reach.
1The Shiller CAPE (Cyclically Adjusted P/E) ratio measures market valuation by dividing an index’s current price by the average of its inflation‑adjusted earnings over the past 10 years. By smoothing out the business cycle, it’s mainly used to compare today’s valuation to history as a long‑term gauge, not a short‑term timing tool.
Disclaimers:
Investing involves risk, including possible loss of principal. Past performance does not guarantee future results. No strategy, including diversification, ensures a profit or prevents loss.
This is for informational purposes only and is not a recommendation nor solicitation to buy, sell or invest in any investment product or strategy. Our materials may contain information deemed to be correct and appropriate at a given time but may not reflect our current views or opinions due to changing market conditions. No information provided should be viewed as or used as a substitute for individualized investment advice. An investor should consider the investment objectives, risks, charges, and expenses of the investment and the strategy carefully before investing.
Please refer to Important Disclosures | Glossary
KAM20260218
Related Perspectives
View All-
Strategy Review – March 2026
March was shaped by a sharp escalation in US-Iran tensions, a surge in energy prices, and renewed concern that inflation could stay stickier than expected. The Federal Reserve again held rates steady, while higher oil prices and rising yields pressured traditional risk assets.
-
Monthly Market Commentary – February 2026
Risk assets delivered mixed but generally positive results in November as investors weighed softer labor data, the ongoing government shutdown, and the prospect of another Federal Reserve rate cut in December.
