Strategy Review – March 2026
(Market Data as of 03/31/2026)
Monthly Strategy Commentary
By Kensington Asset Management Team
March Pressured Stocks and Bonds While Commodities Surged
March was shaped by a sharp escalation in US-Iran tensions, a surge in energy prices, and renewed concern that inflation could stay stickier than expected. The Federal Reserve again held rates steady, while higher oil prices and rising yields pressured traditional risk assets.
U.S. equities moved lower across the board. The S&P 500 Total Return Index fell 4.98% and the Nasdaq 100 declined 4.89% for the month. In fixed income, the Bloomberg U.S. Aggregate Bond Index fell 1.76%, U.S. corporate high yield lost 1.18%, and the 10-Year Treasury finished March at 4.32%.
Outside of stocks and bonds, leadership shifted decisively toward inflation-sensitive assets. Broad commodities, as measured by the S&P GSCI Index Spot, rose 21.98% in March, while the Bloomberg Dollar Spot Index gained 2.36%. Gold declined 11.23% as dollar strength and liquidity needs weighed on traditional safe havens.
Managed Income Strategy
Author: Kensington Asset Management PM Team
| Mar 2026 | YTD | 1 Year | 3 Year | 5 Year | 10 Year | Since Inception | |
| Kensington Managed Income Strategy (*Gross) | -1.38% | -0.24% | 5.41% | 5.71% | 2.71% | 4.80% | 8.16% |
| Kensington Managed Income Strategy (**Net 3%) | -1.63% | -0.98% | 2.30% | 2.59% | -0.32% | 1.70% | 4.97% |
| Bloomberg US Agg Bond TR USD | -1.76% | -0.05% | 4.35% | 3.63% | 0.31% | 1.70% | 2.95% |
Inception date: 12/31/2007 (Returns exceeding one year are annualized.)
Managed Income Strategy returned -1.38% gross (-1.63% net) for the month of March. Most fixed income categories pulled back as geopolitical tensions and higher energy prices pushed yields higher, with the 10-Year Treasury finishing the month at 4.32%.
The Federal Reserve again held rates steady in March, and inflation concerns resurfaced as energy prices moved sharply higher. Against that backdrop, the Strategy maintained Risk-On positioning, holding its core allocation to US high yield corporates with satellite exposure to multisector bonds.
Despite the March pullback in high yield, the Strategy remains Risk-On at present. Further deterioration in the credit markets could lead to a repositioning if a Risk-Off threshold is reached.
Credit Opportunities Strategy
Author: Kensington Asset Management PM Team
| Mar 2026 | YTD | 1 Year | 3 Year | Since Inception | |
| Kensington Credit Opportunities Strategy (*Gross) | -0.99% | -0.30% | 2.04% | 5.22% | 5.42% |
| Kensington Credit Opportunities Strategy (**Net 3%) | -1.24% | -1.03% | -0.97% | 2.11% | 2.30% |
| Bloomberg US Agg Bond TR USD | -1.76% | -0.05% | 4.35% | 3.63% | 3.14% |
Inception date: 09/01/2022 (Returns exceeding one year are annualized.)
Credit Opportunities Strategy returned -0.99% gross (-1.24% net) for March. As credit markets deteriorated during the month, the model-driven process reduced risk in stages, first removing investment grade corporate exposure and then significantly cutting high yield exposure as the selloff intensified.
By month-end, the Strategy had eliminated both high yield and investment grade corporate positions. The portfolio finished approximately two-thirds in U.S. Treasuries, with the balance in cash equivalents.
If volatility persists, Credit Opportunities may remain positioned away from high yield. If trends improve, the Strategy could begin adding credit exposure back into the portfolio.
Dynamic Allocation Strategy
Author: Kensington Asset Management PM Team
| Mar 2026 | YTD | 1 Year | 3 Year | 5 Year | 10 Year | Since Inception | |
| Kensington Dynamic Allocation Strategy (*Gross) | 0.18% | -0.92% | 34.27% | 16.60% | 11.92% | 17.40% | 16.45% |
| Kensington Dynamic Allocation Strategy (**Net 3%) | -0.07% | -1.65% | 30.31% | 13.15% | 8.62% | 13.93% | 13.01% |
| S&P 500 TR USD | -4.98% | -4.33% | 17.80% | 18.32% | 12.06% | 14.16% | 12.76% |
Inception date: 12/31/2014 (Returns exceeding one year are annualized.)
Dynamic Allocation Strategy returned 0.18% gross (-0.07% net) in March. Equity markets moved decisively lower during the month, with the S&P 500 Total Return Index down -4.98% and the Nasdaq 100 down 4.89% as investors reacted to rising geopolitical tension, energy-supply concerns, and renewed inflation pressure.
The relative weakness of the AI trade remained a theme in March, while leadership continued to skew toward energy, materials, and select industrials. Volatility also remained elevated, and the S&P 500 briefly broke below its 200-day moving average during the month.
The Strategy remained in a Risk-Off posture throughout March as volatility climbed. Following month-end, Dynamic Allocation reverted to a Risk-On stance as market conditions improved, and a more stable volatility backdrop could support that positioning into the start of the second quarter.
Active Advantage Strategy
Author: Kensington Asset Management PM Team
| Mar 2026 | YTD | 1 Year | 3 Year | Since Inception | |
| Kensington Active Advantage Strategy (*Gross) | -3.21% | -0.96% | 14.96% | 9.92% | 5.11% |
| Kensington Active Advantage Strategy (**Net 3%) | -3.46% | -1.69% | 11.57% | 6.68% | 2.00% |
| S&P 500 TR / Bloomberg US Agg Bond TR 50-50 | -3.37% | -2.19% | 11.00% | 10.88% | 4.70% |
Inception date: 12/31/2021 (Returns exceeding one year are annualized.)
Active Advantage Strategy returned -3.21% gross (-3.46% net) for March, versus -3.37% for its 50/50 benchmark blend. The Strategy remained fully invested throughout the month, with the portfolio positioned roughly 50% in fixed income and 50% in equities.
The fixed income allocation remained high yield-centric, with satellite exposure to emerging market bonds and multisector holdings. Within equities, the portfolio stayed diversified across core, growth, and high dividend or minimum volatility exposures.
As risk assets sold off, international holdings and US investment grade bonds lagged on the fixed income side, while high dividend equities experienced the shallowest drawdown within the equity sleeve. After month-end, the model indicated an increase in exposure to growth equities, trimming some fixed income positions and shifting the overall mix closer to a 60/40 balance between equities and fixed income.
Defender Strategy
Author: Elio Chiarelli, PhD, AIF – Lead Portfolio Manager, Liquid Strategies
| Mar 2026 | YTD | 1 Year | Since Inception | |
| Kensington Defender Strategy (*Gross) | -4.07% | 5.77% | 20.67% | 10.87% |
| Kensington Defender Strategy (**Net 3%) | -4.32% | 4.99% | 17.11% | 7.60% |
| Morningstar Global 60/40 NR USD | -5.60% | -2.02% | 13.78% | 11.45% |
Inception date: 05/31/2023 (Returns exceeding one year are annualized.)
Defender Strategy returned -4.07% gross (-4.32% net) in March, versus -5.60% for the Morningstar Global 60/40 NR USD Index. March was defined by a sharp rise in geopolitical uncertainty, inflation concerns, and shifting expectations for Federal Reserve policy. Equities and bonds both declined, while broad commodities surged 21.98%, the Bloomberg Dollar Spot Index rose 2.36%, and gold fell 11.23%.
Against that backdrop, commodities, especially energy-related exposure, were meaningful contributors and partially offset weakness in global equities and fixed income. Gold detracted during the month, but it continued to play a diversification role within the portfolio. Equity exposures, particularly international and emerging markets, were a source of pressure in line with the broader market decline.
Importantly, the Strategy reduced risk mid-month as volatility accelerated, which helped mitigate drawdowns during the most unstable stretch of the quarter. Defender continues to lean on a flexible, momentum-driven framework, maintaining a slightly defensive posture while remaining positioned to adjust if conditions improve.
Hedged Premium Income Strategy
Author: Shawn Gibson – CIO, Lead Portfolio Manager, Liquid Strategies
| Mar 2026 | YTD | 1 Year | Since Inception | |
| Hedged Premium Income Strategy (*Gross) | -4.48% | -3.22% | 11.45% | 9.21% |
| Hedged Premium Income Strategy (**Net 3%) | -4.73% | -3.93% | 8.15% | 5.98% |
| S&P 500 TR USD | -4.98% | -4.33% | 17.80% | 12.59% |
Inception date: 08/31/2024 (Returns exceeding one year are annualized.)
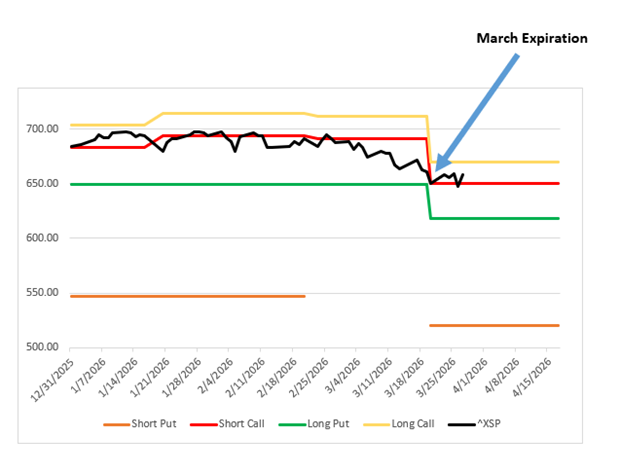
Hedged Premium Income Strategy returned -4.48% gross (-4.73% net) in March, while the S&P 500 Total Return Index declined -4.98%. Volatility increased meaningfully during the month as the market reacted to the Iran conflict and its potential inflationary spillover.
The Strategy entered March with the downside buffer 5.61% below the Index, but with that hedge set to expire on March 20 there was only a limited window for the protection to pay off. The Index fell to the top end of the buffer at expiration before the structure was reset lower into a new 3-month buffer providing protection from -5% to -20%.
A positive offset is that the premium collected from selling the new income-producing call spread moved higher, helping fund the higher cost of downside protection. The reset also establishes a hedge for the next three months in a period where volatility may remain elevated, while the long call continues to offer participation in the event of a sharp rebound.
Disclaimers:
Investing involves risk, including loss of principal. Past performance does not guarantee future results. There is no guarantee any investment strategy and/or diversification will generate a profit or prevent a loss. Targeted distributions are not guaranteed.
This is for informational purposes only and is not a recommendation nor solicitation to buy, sell or invest in any investment product or strategy. Our materials may contain information deemed to be correct and appropriate at a given time but may not reflect our current views or opinions due to changing market conditions. No information provided should be viewed as or used as a substitute for individualized investment advice. An investor should consider the investment objectives, risks, charges, and expenses of the investment and the strategy carefully before investing.
Any indices and other financial benchmarks shown are provided for illustrative purposes only, are unmanaged, reflect reinvestment of income and dividends and do not reflect the impact of advisory fees. Investors cannot invest directly in an index. Comparisons to indexes have limitations because indexes have volatility and other material characteristics that may differ from a particular strategy such as the types of securities being substantially different.
Kensington Asset Management, LLC (“KAM”) relies on third party sources for some of its information that we believe is reliable. However, we make no representation, warranty, endorse or affirm as to its accuracy or completeness. The information provided is current as of the date of publication and may be subject to change. We are not responsible for updating this information to reflect any subsequent developments or events.
Certain information contained herein constitutes “forward-looking statements,” which can be identified using forward-looking terminology such as “may,” “will,” “should,” “expect,” “anticipate,” “project,” “estimate,” “intend,” “continue,” or “believe,” or the negatives thereof or other variations thereon or comparable terminology. Due to various risks and uncertainties, actual events, results, or actual performance may differ materially from those reflected or contemplated in such forward looking statements. Nothing contained herein may be relied upon as a guarantee, promise, assurance, or a representation as to the future.
Advisory services offered through Kensington Asset Management, LLC, Barton Oaks Plaza, Bldg II, 901 S Mopac Expy – Ste 225, Austin, TX 78746. Liquid Strategies, LLC, serves as a Sub Advisor for the Kensington Defender Strategy and investment adviser to Hedged Premium Income Strategy. Liquid Strategies, LLC is not affiliated with KAM. Xtollo Investment Partners, LLC (“XIP”) promotes KAM strategies and funds and receives compensation for these activities, which creates a conflict of interest. XIP is not a registered investment adviser or broker-dealer.
Important Disclosures | Glossary
Kensington Asset Management claims compliance with the Global Investment Performance Standards (GIPS®). For performance, GIPS compliance disclosures and important risks about the investment strategies, visit:
Managed Income Strategy | Credit Opportunities Strategy | Dynamic Allocation Strategy | Active Advantage Strategy | Defender Strategy
Hedged Premium Income Strategy
The Strategy invests in options that derive their performance from the performance of the S&P 500 Index. Selling (writing) and buying options are speculative activities and entail greater than ordinary investment risks. The Strategy’s use of put options can lead to losses because of adverse movements in the price or value of the underlying asset, which may be magnified by certain features of the options. When selling a put option, the Strategy will receive a premium; however, this premium may not be enough to offset a loss incurred by the Strategy if the price of the underlying asset is below the strike price by an amount equal to or greater than the premium. Purchased put options may expire worthless and the Strategy would lose the premium it paid for the option. The Strategy may lose significantly more than the premiums it receives in highly volatile market conditions.
The Strategy will invest in short term put options which are financial derivatives that give buyers the right, but not the obligation, to sell (put) an underlying asset at an agreed-upon price and date. The Strategy’s use of options may reduce the Strategy’s ability to profit from increases in the value of the underlying asset. The Strategy could experience a loss or increased volatility if its derivatives do not perform as anticipated or are not correlated with the performance of their underlying asset
KAM20260413
Related Perspectives
View All-
Monthly Market Commentary – April 2026
US equities moved lower in March as the conflict involving Iran, the US, and Israel pushed energy prices sharply higher and added another layer of uncertainty to an already fragile market backdrop. After
-
Strategy Review – April 2026
March was shaped by a sharp escalation in US-Iran tensions, a surge in energy prices, and renewed concern that inflation could stay stickier than expected. The Federal Reserve again held rates steady, while higher oil prices and rising yields pressured traditional risk assets.
