The Vix’s Take on Volatility
Market Insights
Brian Weisenberger, CFA, Senior Market Strategist
Market Insights is a piece in which Kensington’s Portfolio Management team will share interesting and thought-provoking charts that we believe provide insight into markets and the current investment landscape.
Unpacking the Current State of Market Volatility
While investment returns are typically the primary focus for investors, market volatility (or lack thereof) has recently become a growing focal point. Historically, periods of high and low volatility have been indicative of underlying market dynamics and broader economic conditions. However, recent observations indicate an unusually depressed level of market volatility, particularly as measured by the VIX, often referred to as Wall Street’s “fear gauge.”
The Current State of the VIX
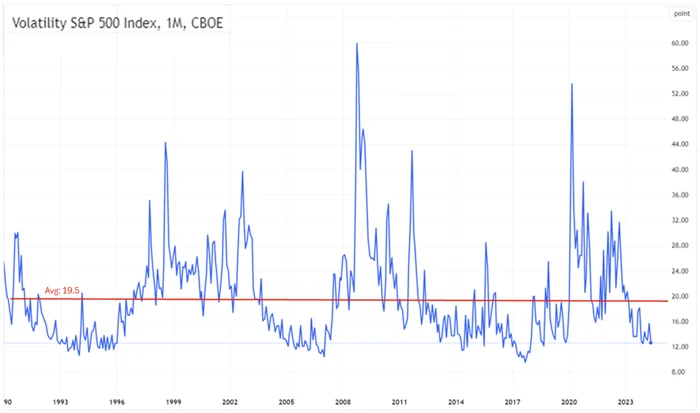
The VIX, which measures the market’s expectation of volatility over the next 30 days, has been steadily declining for almost two years and now sits at historically low levels. The VIX closed at 11.93 last Friday (see chart below), the second-lowest level since November 2019, almost 40% below its long-term average of 19.5. This close ranks in the bottom 5th percentile in the VIX’s history, at a time when uncertainty around Fed action, inflation, and growth remains unresolved. This begs the question: Why is market volatility so subdued despite prevailing economic uncertainties?
Factors Contributing to Depressed Volatility
Rise of Short-Term Options
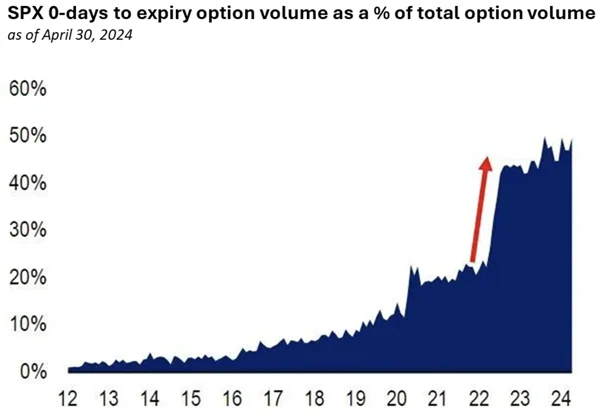
One significant factor contributing to the depressed levels of the VIX is the rise in popularity of short-term options, often referred to as “0DTE” (zero days to expiration) options, a topic we covered in length in February 2023. Today, 0DTE options account for almost 50% of all S&P 500 option volume (chart below). According to a report by the Bank for International Settlements (BIS), the increased use of these short-term options has fundamentally altered the volatility landscape. These options allow traders to speculate on intraday moves without committing to longer-term positions, thereby reducing the overall demand for traditional options that influence the VIX.
Impact of Yield-Enhancing ETFs
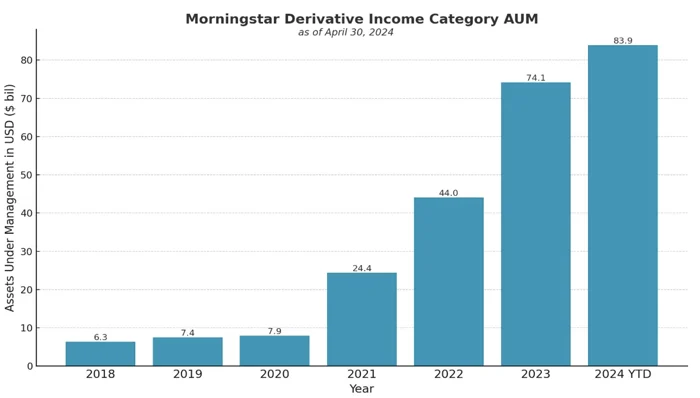
Another potential contributor to lower VIX levels is the role of yield-enhancing ETFs that use options contracts to derive income. The BIS report highlights that these ETFs, designed to generate yield through strategies such as covered calls, have a suppressive effect on volatility. By systematically selling options, these ETFs contribute to lower implied volatility levels, thereby impacting the VIX. The rise of these vehicles, categorized under Derivative Income on Morningstar, has grown by over 300% since COVID (see chart below) as investors seek income not tied to the yield curve. The appetite for these investments is unlikely to subside anytime soon and may continue to weigh down overall VIX levels.
Market Sentiment
Of course, the “Fear Index” may be low simply because investors are not fearful. As we pointed out in our last Market Insights, the labor market is strong, earnings are expected to rise for the remainder of the year, and according to the most recent Consumer Confidence Index from the Conference Board, consumers are bullish on stocks. As of the May survey, 48.2% expected stock prices to increase over the next year, the third-highest reading in history (see chart below), trailing only March 2024 and January 2018.

Historical Performance Based on VIX Levels
Assuming this recent lull is not a paradigm shift for the VIX forever, it can be useful to evaluate how markets have tended to perform when volatility slumps. There are those that point to a low VIX as a sign of calmness and opportunity for significant gains. Others point to a low VIX as a “canary in the coal mine” warning for rocky markets ahead.
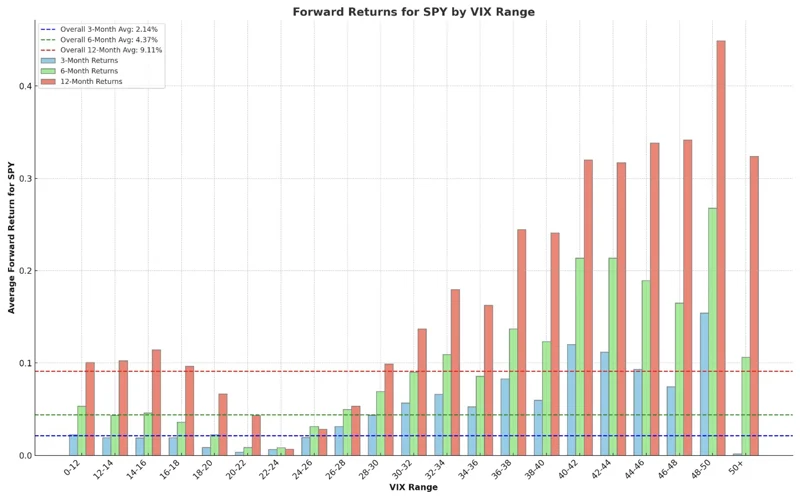
Historically, the truth lies somewhere in the middle. Dating back to 1993, S&P 500 (SPY) returns when the VIX is low, tend to be quite average (chart below) over 3-, 6- and 12-month time frames, with the average forward 12-month return coming in at approximately 10%, compared to an overall 12-month average return of 9.11%. Interestingly, the lowest returns typically coincide with mid-range VIX levels (20-28), while the highest returns are observed when the VIX is extremely elevated. This pattern suggests that while low volatility periods are generally stable, the most significant opportunities for returns may arise during times of heightened market uncertainty.
Conclusion
The pressing question for investors now is whether the current state of the VIX is indicative of historical periods of low volatility that tend to lead to stable, average returns, or if the rise of 0DTE options and yield-enhancing ETFs has shifted the overall landscape. This evolving environment challenges the traditional interpretation of low VIX levels. We likely won’t know the full impact until it’s in the rearview mirror. Therefore, remaining nimble and tactical is critical in today’s markets. Embracing a flexible approach will allow investors to navigate potential shifts and capitalize on opportunities as they arise.
Disclaimers:
Investing involves risk, including loss of principal. Past performance does not guarantee future results. There is no guarantee any investment strategy will generate a profit or prevent a loss.
This is for informational purposes only and is not a recommendation nor solicitation to buy, sell or invest in any investment product or strategy. Our materials may contain information deemed to be correct and appropriate at a given time but may not reflect our current views or opinions due to changing market conditions. No information provided should be viewed as or used as a substitute for individualized investment advice. An investor should consider the investment objectives, risks, charges, and expenses of the investment and the strategy carefully before investing.
Kensington Asset Management, LLC (“KAM”) relies on third party sources for some of its information that we believe is reliable. However, we make no representation, warranty, endorse or affirm as to its accuracy or completeness. The information provided is current as of the date of publication and may be subject to change. We are not responsible for updating this information to reflect any subsequent developments or events.
Certain information contained herein constitutes “forward-looking statements,” which can be identified using forward-looking terminology such as “may,” “will,” “should,” “expect,” “anticipate,” “project,” “estimate,” “intend,” “continue,” or “believe,” or the negatives thereof or other variations thereon or comparable terminology. Due to various risks and uncertainties, actual events, results, or actual performance may differ materially from those reflected or contemplated in such forward-looking statements. Nothing contained herein may be relied upon as a guarantee, promise, assurance, or a representation as to the future.
Advisory services offered through Kensington Asset Management, LLC, Barton Oaks Plaza, Bldg II, 901 S Mopac Expy – Ste 225, Austin, TX 78746.
Options are not for everyone. Before engaging in the purchasing or writing of options, investors should understand the nature and extent of their rights and obligations and be aware of the risks involved, including the risks pertaining to the business and financial condition of the issuer and the underlying stock or index. A secondary market may not exist for options. Investors who are purchasing or writing exchange-traded options, your attention is called to the publication “Characteristics and Risks of Standardized Options”. That publication, which you should have read and understood prior to investing in options, can be viewed here.
Related Perspectives
View All-
KHPI’s Fiscal Year 2025 Review and the Power of Net-of-Tax Performance
KHPI’s Fiscal Year 2025 Review and the Power of Net-of-Tax Performance Monthly Market Commentary By Kensington Asset Management Team The following is for informational purposes only and not construed as tax advice. Please consult with a tax professional for your specific situation. For the modern fiduciary, performance is a multi-dimensional metric. While investment returns capture […]
-
KENSINGTON SPOTLIGHT SERIES: THE DEFENDER STRATEGY
At Kensington Asset Management, we’ve actively managed fixed income solutions for clients for over three decades. Throughout this journey, we’ve weathered all types of macroeconomic regimes from extreme market volatility events to periods of steady growth.
