2025 Investment Strategies Review
Monthly Strategy Commentary
By Brian Weisenberger, CFA, Managing Director, Chief Market Strategist
Introduction
The 2025 Strategies Year in Review reflects Kensington Asset Management’s continued focus on navigating complex markets with discipline, flexibility, and a data-driven approach. The year featured meaningful crosscurrents across both equities and fixed income, including shifting expectations around trade policy, inflation, and the path of monetary policy, along with periods of volatility that rewarded adaptive risk management.
Against this backdrop, each strategy sought to balance participation in upside opportunities with prudent defense during episodes of stress. The commentaries that follow highlight how our portfolio teams responded to changing regimes across risk assets, credit, and rates, and how our systematic frameworks guided allocation decisions throughout the year.
As we look ahead to 2026, we believe investors should remain focused on the potential for leadership rotation, policy-driven volatility, and evolving macro and geopolitical dynamics. While no single forecast can capture the full range of outcomes, we remain committed to proactive management and innovation with the goal of delivering value, resilience, and clarity for our investors.
Managed Income Strategy: 2025 Year in Review
Performance
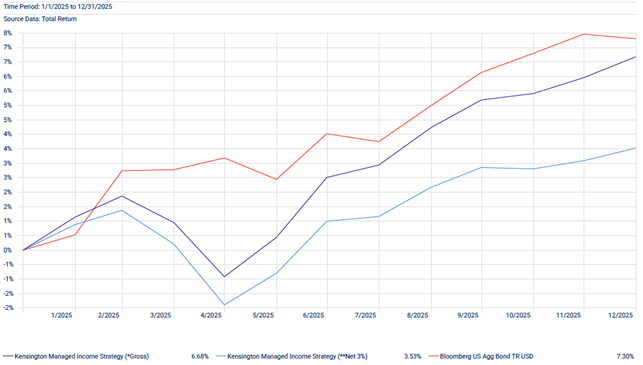
| QTD | YTD | 1 Year | 3 Years | 5 Years | 10 Years | 15 Years | Since Inception | |
| Kensington Managed Income Strategy (*Gross) | 1.42% | 6.68% | 6.68% | 5.81% | 2.99% | 5.19% | 5.73% | 8.29% |
| Kensington Managed Income Strategy (**Net 3%) | 0.65% | 3.53% | 3.53% | 2.68% | -0.06% | 2.08% | 2.61% | 5.09% |
| Bloomberg US Agg Bond TR USD | 1.10% | 7.30% | 7.30% | 4.66% | -0.36% | 2.01% | 2.42% | 2.99% |
As of 12/31/2025
Commentary:
Fixed income markets in 2025 were shaped by shifting expectations around growth, inflation, and monetary policy. Early in the year, resilient economic data and tight credit spreads supported higher-yielding sectors, and Managed Income maintained a prolonged Risk-On posture with an emphasis on income-oriented credit. For the year, the Strategy returned 6.68% gross (3.53% net).
As volatility surfaced during the year, driven by trade policy uncertainty and evolving inflation and labor market signals, the Strategy sought to remain selective and defensive at key inflection points. In the second and third quarters, easing inflation pressures and growing confidence in eventual Federal Reserve rate cuts helped support a broad recovery across fixed income sectors.
Momentum extended into the fourth quarter as policy easing became more explicit. The Federal Reserve delivered two 25-basis-point rate cuts, lowering the Federal Funds target range to 3.50%-3.75% by year-end, while acknowledging rising downside risks to employment. High yield, bank loans, senior loans, and asset-backed securities led returns, while long-duration Treasuries lagged.
Throughout the fourth quarter, and for eight consecutive months overall, Managed Income remained fully Risk-On, with US high yield as the core allocation and a complementary satellite position in multisector fixed income. This positioning reflected an intentional emphasis on lower duration and income-oriented exposures.
Dynamic Allocation Strategy: 2025 Year in Review
Performance:
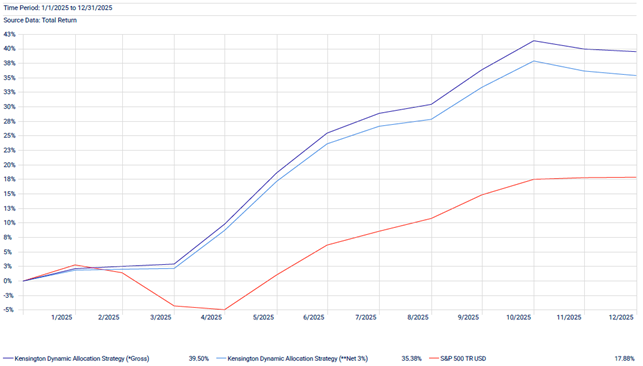
| QTD | YTD | 1 Year | 3 Years | 5 Years | 10 Years | Since Inception | |
| Kensington Dynamic Allocation Strategy (*Gross) | 2.30% | 39.50% | 39.50% | 18.50% | 13.56% | 18.42% | 16.94% |
| Kensington Dynamic Allocation Strategy (**Net 3%) | 1.53% | 35.38% | 35.38% | 15.00% | 10.20% | 14.92% | 13.49% |
| S&P 500 TR USD | 2.66% | 17.88% | 17.88% | 23.01% | 14.42% | 14.82% | 13.53% |
As of 12/31/2025
Commentary:
Equity markets in 2025 began with strong upside momentum before trade policy uncertainty triggered a sharp selloff in March and early April. Dynamic Allocation’s disciplined risk framework sought being Risk-Off during the bulk of the drawdown and reentered equities ahead of the powerful rebound that followed, setting the foundation for strong full-year results. The Strategy gained 39.50% gross (35.38% net) in 2025.
Through the middle quarters of the year, markets stabilized and advanced amid resilient earnings, easing inflation pressures, and renewed enthusiasm for artificial intelligence-related themes. Leadership remained concentrated among large-cap growth stocks, while broader participation gradually improved. Dynamic Allocation remained predominantly Risk- On, maintaining a blend of growth and core large-cap equities while remaining prepared to adjust as conditions evolved.
In the fourth quarter, most major equity indices posted gains in October and expectations for multiple Federal Reserve rate cuts were ultimately realized. Volatility resurfaced late in the year as growth stocks pulled back in November and December, contributing to the Strategy’s first negative monthly return since October 2024 and a modestly negative December. Even so, the Strategy ended the year on an extended 35-week stretch of Risk-On positioning, supported by its emphasis on managing drawdowns and reengaging when conditions improved.
Active Advantage Strategy: 2025 Year in Review

Performance:
| QTD | YTD | 1 Year | 3 Years | Since Inception | |
| Kensington Active Advantage Strategy (*Gross) | 2.10% | 13.45% | 13.45% | 10.09% | 5.65% |
| Kensington Active Advantage Strategy (**Net 3%) | 1.33% | 10.10% | 10.10% | 6.84% | 2.53% |
| S&P 500 TR/Bloomberg US Agg Bond TR 50-50 | 1.88% | 12.64% | 12.64% | 13.62% | 5.58% |
As of 12/31/2025
Commentary:
The Active Advantage Strategy navigated a highly dynamic environment during 2025, with positioning shaped by shifting volatility, evolving macro risks, and changing leadership across asset classes. Entering the year in a fully Risk-On posture, the Strategy maintained a balanced allocation between equities and fixed income, emphasizing high yield and floating-rate credit on the fixed income side and a diversified equity sleeve anchored in core US equities.
As volatility increased during the first quarter, escalating trade policy uncertainty and deteriorating investor sentiment pressured growth-oriented equities. Active Advantage reduced equity exposure and moved more defensively by mid-March, with a meaningful allocation to cash equivalents and short-term Treasuries by quarter end.
The second quarter marked a constructive inflection point as markets rebounded sharply following the early-April selloff. Active Advantage reengaged risk assets and rotated back toward a fully invested posture as volatility subsided. The Strategy maintained its balanced structure, with fixed income emphasizing high yield, emerging market debt, and multisector bonds, and an equity sleeve diversified across core, growth, dividend, and low-volatility strategies.
Momentum carried into the third quarter as equity markets extended gains and credit conditions remained supportive. To end the year, growth equities retreated from prior highs. However, satellite equity positions in value and core, alongside the fixed income portfolio, helped support results, contributing to positive fourth-quarter performance. The Strategy returned 13.45% gross (10.10% net) for the year.
Credit Opportunities Strategy: 2025 Year in Review

Performance:
| QTD | YTD | 1 Year | 3 Years | Since Inception | |
| Kensington Credit Opportunities Strategy (*Gross) | 1.09% | 3.92% | 3.92% | 6.21% | 6.07% |
| Kensington Credit Opportunities Strategy (**Net 3%) | 0.33% | 0.85% | 0.85% | 3.07% | 2.93% |
| Bloomberg US Agg Bond TR USD | 1.10% | 7.30% | 7.30% | 4.66% | 4.89% |
As of 12/31/2025
Commentary:
The Credit Opportunities Strategy began 2025 positioned across high yield bonds, investment grade corporates, and securitized debt as fixed income trends were positive during the first several weeks of the year. As conditions deteriorated amid uncertainty surrounding US trade policy, the Strategy reduced high yield exposure significantly following a sharp decline across fixed income, particularly in high yield.
The Strategy remained broadly defensive as markets reversed, maintaining a mix of cash equivalents and US Treasuries. While this defensive posture led to more muted returns as high yield recovered, the Strategy remained disciplined and added risk incrementally through the second quarter.
By the fourth quarter, after rate cuts had materialized, the Strategy added to its high yield position and US Treasury positions. This resulted in a portfolio still dominated by high yield, but with complementary satellite positions in investment grade corporates, asset-backed securities, and Treasuries. The Strategy delivered a positive return in 2025 (3.92% gross / 0.85% net) while maintaining a disciplined, defense-first posture during the recovery.
Looking forward, Credit Opportunities remains focused on generating compelling yield while staying nimble to adjust positioning as opportunities emerge and economic conditions evolve.
Looking Ahead to 2026
As we move into 2026, we are monitoring several key themes that could influence both the equity and fixed income landscape.
AI and market leadership: Technology and AI-related themes have driven large portions of recent equity gains, and the market may increasingly evaluate the balance between the scale of investment spending and realized earnings outcomes.
Macro and policy regimes: Central banks continue to react to inflation and growth data. In the United States, the Federal Reserve may remain under pressure to continue easing, with additional uncertainty as Chair Jerome Powell’s term ends in 2026. The yield curve continues to normalize and inflation has been tamed for now, but renewed spikes could reintroduce volatility.
Geopolitics and trade: Emerging markets benefited in 2025 amid a weaker dollar. Trade policy and cross-border capital flows remain important swing factors, with the potential for renewed trade tensions to impact risk assets and Treasury markets.
With these themes in mind, here is our playbook for 2026:
| If we see this… | We could expect this… |
| Status quo | Market breadth could continue to increase as the Magnificent Seven cede leadership to other areas such as small caps and value. Most areas of fixed income remain attractive for investment. |
| AI growth boom continues | Risk-On remains the dominant regime for equities as technology leadership reasserts itself. |
| Inflation stays moderated | Tailwinds for fixed income continue across most sectors. |
| Trade tensions escalate once more | Episodic Risk-Off conditions emerge across risk assets. Treasury yields, especially on the long end, could spike if foreign investors shift away from US Treasuries. |
We believe a flexible, rules-based approach remains important in an environment where leadership can rotate and policy risks can surface quickly. Across strategies, our goal remains consistent: participate when conditions are supportive and move defensively when evidence breaks down.
Kensington Defender Strategy: 2025 Year in Review
Performance:
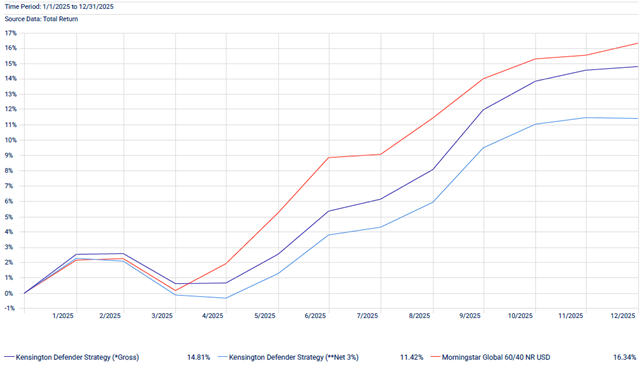
| QTD | YTD | 1 Year | Since Inception | |
| Kensington Defender Strategy (*Gross) | 2.52% | 14.81% | 14.81% | 9.58% |
| Kensington Defender Strategy (**Net 3%) | 1.75% | 11.42% | 11.42% | 6.34% |
| Morningstar Global 60/40 NR USD | 2.04% | 16.34% | 16.34% | 13.51% |
As of 12/31/2025
Commentary:
Markets in 2025 delivered strong absolute returns but also meaningful dispersion across regions and asset classes, alongside an important transition in leadership. While US equities posted solid gains, international developed and emerging markets were notable sources of strength as leadership broadened beyond US mega-cap growth stocks.
Against this backdrop, Defender navigated the year through its systematic, momentum-driven framework, maintaining diversified exposure across US equities, international markets, and real assets, while incorporating defensive positioning and risk-management overlays as conditions evolved.
Gold was a meaningful contributor, supported by persistent central bank demand, geopolitical tensions, and longer-term fiscal and currency concerns. International equities also contributed, with emerging markets, Japan, and other developed exposures benefiting from improving momentum and investor rotation away from US-centric positioning. As the year progressed, the Strategy’s momentum indicators reflected broader participation, culminating in positive signals across all twelve monitored categories heading into year-end. The Strategy returned 14.81% gross (11.42% net) in 2025.
Defender: 2026 Outlook
As 2026 begins, markets appear to be transitioning toward broader participation, moderating growth, and increased dispersion across regions and asset classes. In this environment, adaptability, diversification, and disciplined risk management remain central.
Defender enters the new year with a constructive but disciplined posture, with primary exposures including Gold, the Nasdaq 100, Emerging Markets, Japan, US Small Caps, and Europe. This positioning reflects a rotation away from the S&P 500 and toward areas exhibiting improving relative strength.
Looking forward, we anticipate 2026 to reward flexibility over conviction and diversification over concentration. The Strategy remains designed to participate in sustained advances while seeking to reduce drawdowns during periods of heightened volatility through its systematic momentum-based process and defensive overlays.
Hedged Premium Income Strategy: 2025 Year in Review
Performance:
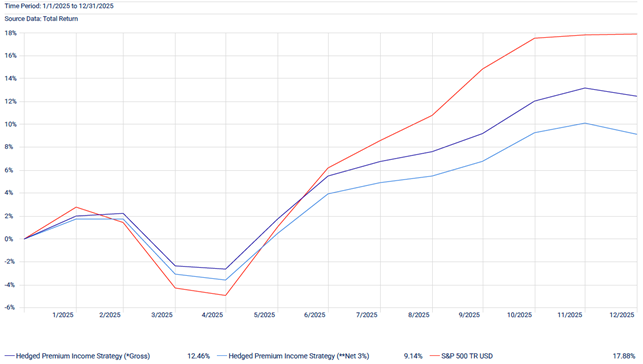
| QTD | YTD | 1 Year | Since Inception | |
| Hedged Premium Income Strategy (*Gross) | 2.98% | 12.46% | 12.46% | 13.05% |
| Hedged Premium Income Strategy (**Net 3%) | 2.21% | 9.14% | 9.14% | 9.71% |
| S&P 500 TR USD | 2.66% | 17.88% | 17.88% | 16.26% |
As of 12/31/2025
Commentary:
After weathering a significant equity drawdown in the first half of 2025, the Hedged Premium Income SMA finished the year with a gross return of 12.46% (9.14% net). The Strategy’s 2025 return compared favorably with several widely used income-oriented asset classes, including high yield, aggregate bonds, preferred equities, and REITs.
Because the strategy employs a defined options structure that trades some upside participation for income and downside mitigation, it is expected to lag in sharply rising equity markets. In 2025, the S&P 500 Total Return Index returned 17.88%. However, investors in the Strategy benefited from both income generation and downside risk management. During the February to April drawdown, the S&P 500 Index declined 18.75% on a closing basis, while the Strategy declined 10.74%, leaving a smaller drawdown to recover from during the subsequent rally.
In addition to quarterly downside buffers, the Strategy maintains upside participation through long calls intended to offset lost appreciation in the call-writing positions once the market advances beyond certain levels within a monthly cycle. An example occurred during the 4/17/25 to 5/16/25 cycle, when the S&P 500 Index gained 12.94%. During that period, the Strategy generated a positive return of 7.24%, reflecting the contribution of upside-oriented option positioning.
Hedged Premium Income Strategy: Looking Ahead to 2026
Despite a long list of potential concerns, the capital markets landscape appears relatively calm heading into 2026, with equity volatility low, credit spreads tight, and Treasury volatility subdued.
Even in strong market years, investors often experience unexpected stress, as was the case in 2025. The Hedged Premium Income Strategy is structured to seek to generate income in certain environments, participate in a portion of market upside, and manage downside risk during periods of market stress. As such, the Strategy is positioned for a wide range of potential outcomes.
Disclaimers:
Investing involves risk, including loss of principal. Past performance does not guarantee future results. There is no guarantee any investment strategy and/or diversification will generate a profit or prevent a loss. Targeted distributions are not guaranteed. For the most recent strategy performance, please visit our website: www.kensingtonassetmanagement.com.
This is for informational purposes only and is not a recommendation nor solicitation to buy, sell or invest in any investment product or strategy. Our materials may contain information deemed to be correct and appropriate at a given time but may not reflect our current views or opinions due to changing market conditions. No information provided should be viewed as or used as a substitute for individualized investment advice. An investor should consider the investment objectives, risks, charges, and expenses of the investment and the strategy carefully before investing.
Any indices and other financial benchmarks shown are provided for illustrative purposes only, are unmanaged, reflect reinvestment of income and dividends and do not reflect the impact of advisory fees. Investors cannot invest directly in an index. Comparisons to indexes have limitations because indexes have volatility and other material characteristics that may differ from a particular strategy such as the types of securities being substantially different.
KAM relies on third party sources for some of its information that we believe is reliable. However, we make no representation, warranty, endorse or affirm as to its accuracy or completeness. The information provided is current as of the date of publication and may be subject to change. We are not responsible for updating this information to reflect any subsequent developments or events.
Certain information contained herein constitutes “forward-looking statements,” which can be identified using forward-looking terminology such as “may,” “will,” “should,” “expect,” “anticipate,” “project,” “estimate,” “intend,” “continue,” or “believe,” or the negatives thereof or other variations thereon or comparable terminology. Due to various risks and uncertainties, actual events, results, or actual performance may differ materially from those reflected or contemplated in such forwardlooking statements. Nothing contained herein may be relied upon as a guarantee, promise, assurance, or a representation as to the future.
Advisory services offered through Kensington Asset Management, LLC, Barton Oaks Plaza, Bldg II, 901 S Mopac Expy – Ste 225, Austin, TX 78746. Liquid Strategies, LLC, serves as a Sub Advisor for the Kensington Defender Strategy and investment adviser to Hedged Premium Income Strategy. Liquid Strategies, LLC is not affiliated with KAM.
Important Disclosures | Glossary
Kensington Asset Management claims compliance with the Global Investment Performance Standards (GIPS®). For performance, GIPS compliance and important risks about the investment strategies, visit:
Managed Income Strategy | Credit Opportunities Strategy | Dynamic Allocation Strategy | Active Advantage Strategy | Defender Strategy
Hedged Premium Income Strategy
The Strategy invests in options that derive their performance from the performance of the S&P 500 Index. Selling (writing) and buying options are speculative activities and entail greater than ordinary investment risks. The Strategy’s use of put options can lead to losses because of adverse movements in the price or value of the underlying asset, which may be magnified by certain features of the options. When selling a put option, the Strategy will receive a premium; however, this premium may not be enough to offset a loss incurred by the Strategy if the price of the underlying asset is below the strike price by an amount equal to or greater than the premium. Purchased put options may expire worthless and the Strategy would lose the premium it paid for the option. The Strategy may lose significantly more than the premiums it receives in highly volatile market conditions.
The Strategy will invest in short term put options which are financial derivatives that give buyers the right, but not the obligation, to sell (put) an underlying asset at an agreed-upon price and date. The Strategy’s use of options may reduce the Strategy’s ability to profit from increases in the value of the underlying asset. The Strategy could experience a loss or increased volatility if its derivatives do not perform as anticipated or are not correlated with the performance of their underlying asset or if the Strategy is unable to purchase or liquidate a position.
KAM20260122
Related Perspectives
View All-
Monthly Market Commentary – March 2026
US equities moved lower in March as the conflict involving Iran, the US, and Israel pushed energy prices sharply higher and added another layer of uncertainty to an already fragile market backdrop. After
-
Strategy Review – March 2026
March was shaped by a sharp escalation in US-Iran tensions, a surge in energy prices, and renewed concern that inflation could stay stickier than expected. The Federal Reserve again held rates steady, while higher oil prices and rising yields pressured traditional risk assets.
