

Proprietary trend-following system generates distinct model postures depending on the combination of asset class Risk-On / Risk-Off signals, allowing the Strategy to shift asset class exposures significantly based upon model outputs.
Performance Statistics (Composite)
as of 6/30/2024

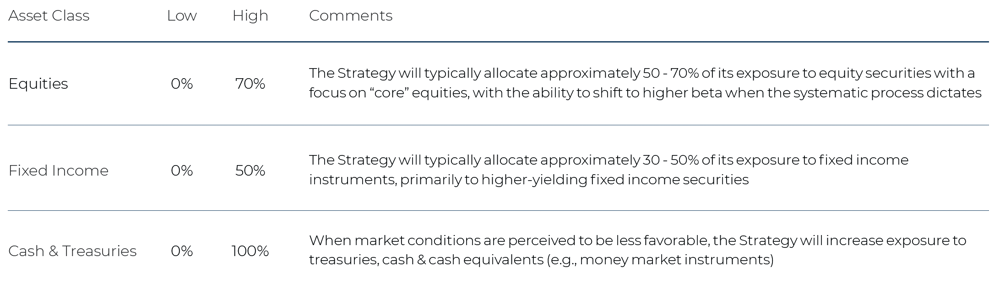
Allocation Ranges
Disclosures
Source: Morningstar, Inc.
As of 6/30/2024. Inception Date 12/31/2021. Standard Deviation: A measure of the dispersion of monthly returns from its mean return, also known as historical volatility. Sharpe Ratio: A risk-adjusted measure of a fund’s performance that indicates a fund’s return per unit of risk, defining risk as volatility (standard deviation). Sortino Ratio: A variation of the Sharpe Ratio that includes only the standard deviation of negative portfolio returns instead of the total standard deviation. Maximum Drawdown: A measure of the maximum loss from a peak to a trough of a portfolio or index, before a new peak is attained. Upside / Downside Capture Ratio: A measurement of performance relative to positive or negative periods for the benchmark. Correlation: A measurement of the degree to which two indices move in relation to each other.
Kensington Asset Management claims compliance with the Global Investment Performance Standards (GIPS®). Kensington Asset Management has been independently verified for the period of January 1, 2022 through December 31, 2022. An investment in securities involves risk, including the loss of principal. Returns are presented net of fees and include the reinvestment of all income. Performance represents past performance, which is not an indicator of future results. The benchmark is a 50/50 blend of the S&P 500 TR Index and the Bloomberg Aggregate Bond Index.
Kensington Asset Management does not charge an advisory fee.
*Gross returns do not include the deduction of transaction costs and are shown as supplemental information
**Net performance values reflect the deduction of model fees of 3% as the highest possible fee that would be charged to an investor and may not reflect actual deducted fees.
The Active Advantage Strategy is managed by Kensington Asset Management, LLC. Additional information about the Strategy and the adviser can be obtained by viewing company disclosure documents available upon request. Past performance is not indicative of future returns and the value of the investments and the income derived from them can go down as well as up. Future returns are not guaranteed and a loss of principal may occur. There is no guarantee any investment strategy will generate a profit or prevent a loss. Investing in securities involves risk, including loss of principal. The risks associated with this Strategy include general market risk, credit risk, interest rate risk or risk of the portfolio not performing as expected.
Advisory services offered through Kensington Asset Management, LLC, Barton Oaks Plaza, Bldg II, 901 S Mopac Expy - Ste 225, Austin, TX 78746.
©2023 Kensington Asset Management, LLC

Most recent strategy returns, key statistics, exposures and holdings related data
Overview of our investment universe, philosophy, process and portfolio characteristics