April 2025: A Month of Reversals and Resilience Across Markets
Monthly Market Commentary
By Kensington Asset Management Team
stock Market
The stock market endured one of its most volatile months in years. The S&P 500 fell 21.35% from its February 19 peak of 6,147.43 before bottoming on April 7 at 4,835.04, shortly before the Administration announced a 90-day pause on new tariffs (excluding China). Markets quickly rebounded on the news, with the S&P 500 soaring 9.52% on April 9, its largest single-day gain since October 2008. The Nasdaq Composite jumped 12.16% the same day, marking its biggest one-day percentage gain since January 3, 2001, and the second-largest on record.
This dramatic reversal fueled an intra-month rebound, with the S&P 500 ultimately finishing the month down just -0.76%, despite having been down as much as -13.84% earlier. The Nasdaq Composite managed a modest gain of 0.09%, while the Russell 2000 declined -2.38%, mirroring the return of the S&P 500 Equal Weighted Index. Meanwhile, the mega-cap tech-heavy Nasdaq 100 posted a monthly gain of 1.52%.
In late April, the market, as measured by both the NYSE Composite Index and the S&P 500, triggered a Zweig Breadth Thrust (ZBT), the 17th occurrence since 1950. This rare technical signal is generated when a 10-day moving average of advancing issues jumps from below 40% to above 61.5% in just 10 trading days. Historically, the S&P 500 has been higher six months and one year later in every prior instance, with an average one-year gain of 23.78%.
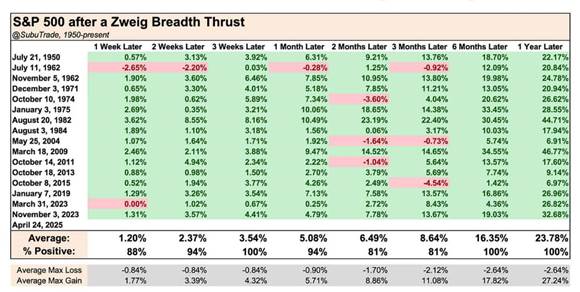
Source: Subu Trade as of May 8, 2025
While past results are encouraging, it’s important to note the relatively small sample size of prior signals. A broader historical lens, including periods like the Great Depression and post-WWII recovery, shows more mixed outcomes, underscoring the importance of interpreting such signals in context.
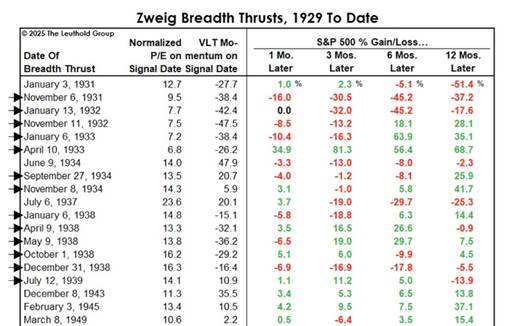
Leuthold Group as of May 5, 2025
Source: StockCharts.com as of May 14, 2025
Fixed Income
Bond markets were mixed again in April, echoing the performance trends seen in March. Shorter-duration Treasuries delivered gains, with 2-year and 5-year yields up 0.82% and 1.36%, respectively, while the 10-year Treasury returned 0.78%. In contrast, the 30-year Treasury declined by -1.38% for the second month in a row. Bloomberg US Mortgage-Backed Securities Index posted a slight gain of 0.29%, and both Bloomberg US Corporate Investment-Grade and High-yield Indices were little changed, at -0.03% and -0.02%, respectively.
The 30-year Treasury continues to reflect crosscurrents in the macroeconomic landscape. One factor may be a gradual rebalancing of global portfolios, as investors reassess long-term exposures following a decade of strong US outperformance. In addition, policy shifts such as increased tariffs, changes in defense spending expectations, and ongoing discussions about the dollar’s international role may also be contributing to evolving investor preferences.
Another consideration is the potential for structurally higher inflation, driven by factors including onshoring of supply chains, a higher baseline level of tariffs, immigration policy, and a growing fiscal deficit. These dynamics could eventually lead to changes in how deficits are financed. Should interest costs continue rising, there may be renewed debate around tools like yield curve control to manage long-term borrowing costs, a strategy that historically has trade-offs, including inflation risks.
Federal Reserve and Monetary Policy
As expected, the Federal Reserve left interest rates unchanged at its most recent FOMC meeting (May 6, 2025), citing a desire to see clearer evidence on the trajectory of inflation and growth. A key question remains whether the latest round of tariffs will lead to a temporary increase in prices or contribute to more persistent inflationary pressure, a scenario the Fed is keen to avoid.
There are already indications that price increases may be broadening beyond directly affected goods. Even so, official inflation data has continued to trend lower. Both the Personal Consumption Expenditures (PCE) and Consumer Price Index (CPI) reports came below expectations.
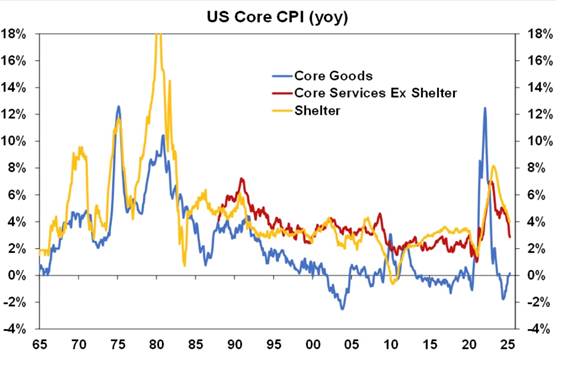
Source: AMP Capital as of May 13, 2025
The AMP Pipeline Inflation Indicator, which incorporates commodity prices, shipping rates, Purchasing Managers’ Index (PMI) surveys, and China’s PPI, is currently signaling inflation just above 2% year over year.
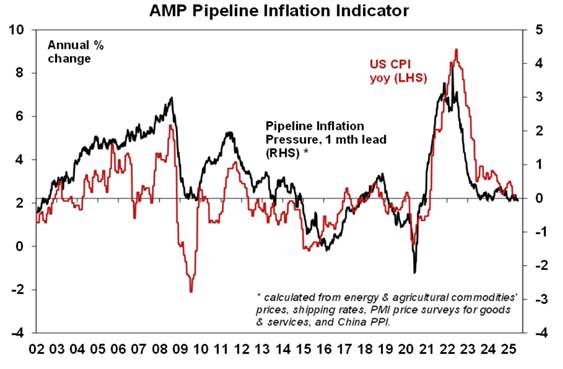
Source: AMP Capital as of May 13, 2025
Source: AMP Capital as of May 13, 2025
Taken together, recent data suggests that the inflation outlook remains relatively stable. In a different policy environment, absent the uncertainty surrounding tariffs, the Fed might have more flexibility to consider rate cuts. For now, the focus remains on monitoring inflation developments and economic resilience in the face of shifting trade dynamics.
Disclaimers:
Investing involves risk, including loss of principal. Past performance does not guarantee future results. There is no guarantee any investment strategy will generate a profit or prevent a loss.
This is for informational purposes only and is not a recommendation nor solicitation to buy, sell or invest in any investment product or strategy. Our materials may contain information deemed to be correct and appropriate at a given time but may not reflect our current views or opinions due to changing market conditions. No information provided should be viewed as or used as a substitute for individualized investment advice. An investor should consider the investment objectives, risks, charges, and expenses of the investment and the strategy carefully before investing.
Kensington Asset Management, LLC (“KAM”) relies on third party sources for some of its information that we believe is reliable. However, we make no representation, warranty, endorse or affirm as to its accuracy or completeness. The information provided is current as of the date of publication and may be subject to change. We are not responsible for updating this information to reflect any subsequent developments or events.
Any indices and other financial benchmarks shown are provided for illustrative purposes only, are unmanaged, reflect reinvestment of income and dividends and do not reflect the impact of advisory fees. Investors cannot invest directly in an index. Comparisons to indexes have limitations because indexes have volatility and other material characteristics that may differ from a particular strategy such as the types of securities being substantially different.
Certain information contained herein constitutes “forward-looking statements,” which can be identified using forward-looking terminology such as “may,” “will,” “should,” “expect,” “anticipate,” “project,” “estimate,” “intend,” “continue,” or “believe,” or the negatives thereof or other variations thereon or comparable terminology. Due to various risks and uncertainties, actual events, results, or actual performance may differ materially from those reflected or contemplated in such forward-looking statements. Nothing contained herein may be relied upon as a guarantee, promise, assurance, or a representation as to the future.
Advisory services offered through Kensington Asset Management, LLC, Barton Oaks Plaza, Bldg II, 901 S Mopac Expy – Ste 225, Austin, TX 78746.
Definitions:
Bloomberg US Corporate Investment Grade Index: An unmanaged index that covers the publicly issued US corporate and specified foreign debentures and secured notes that meet the specified maturity, liquidity, and quality requirements. To qualify, bonds must be SEC-registered.
Bloomberg US Corporate High Yield Index: An unmanaged market value-weighted index that covers the universe of fixed-rate, non-investment grade debt in the US. Securities are classified as high yield if the middle rating of Moody’s, Fitch and S&P is Ba1/BB+/BB+ or below. Bonds from issuers with an emerging markets country of risk, based on the indices’ EM country definition, are excluded.
Bloomberg US Mortgage-Backed Securities (MBS) Index:An unmanaged index that tracks fixed-rate agency mortgage-backed pass-through securities guaranteed by Ginnie Mae (GNMA), Fannie Mae (FNMA), and Freddie Mac (FHLMC). The index is constructed by grouping individual TBA-deliverable MBS pools into aggregates or generics based on program, coupon, and vintage.
NASDAQ 100 Index: A market index that comprises of the 100 largest, most actively traded companies listed on the Nasdaq stock exchange.
NASDAQ Composite: A market capitalization-weighted index that includes over 2,500 stocks listed on the NASDAQ stock exchange. It is heavily weighted towards the technology sector, making it a key indicator of tech industry performance.
Russell 2000 Index: A market index that consists of 2,000 small-cap US companies that are part of the larger Russell 3000 Index.
S&P 500: A capitalization weighted index of 500 stocks representing all major domestic industry groups. The S&P 500 TR Index assumes the reinvestment of dividends and capital gains.
S&P 500 Equal Weight Index:Equal weight to each of the 500 companies in the S&P 500, ensuring that each company has the same impact on the index’s performance, regardless of its market capitalization
Zweig Breadth Thrust: A technical indicator that signals potential major market uptrends. It occurs when the 10-day moving average of the ratio of advancing stocks to total advancing and declining stocks moves from below 40% to above 61.5% within 10 days, indicating a sudden surge in market momentum.
KAM20250515
Related Perspectives
View All-
Strategy Review – May 2026
March was shaped by a sharp escalation in US-Iran tensions, a surge in energy prices, and renewed concern that inflation could stay stickier than expected. The Federal Reserve again held rates steady, while higher oil prices and rising yields pressured traditional risk assets.
-
Monthly Market Commentary – May 2026
US equities moved lower in March as the conflict involving Iran, the US, and Israel pushed energy prices sharply higher and added another layer of uncertainty to an already fragile market backdrop. After
